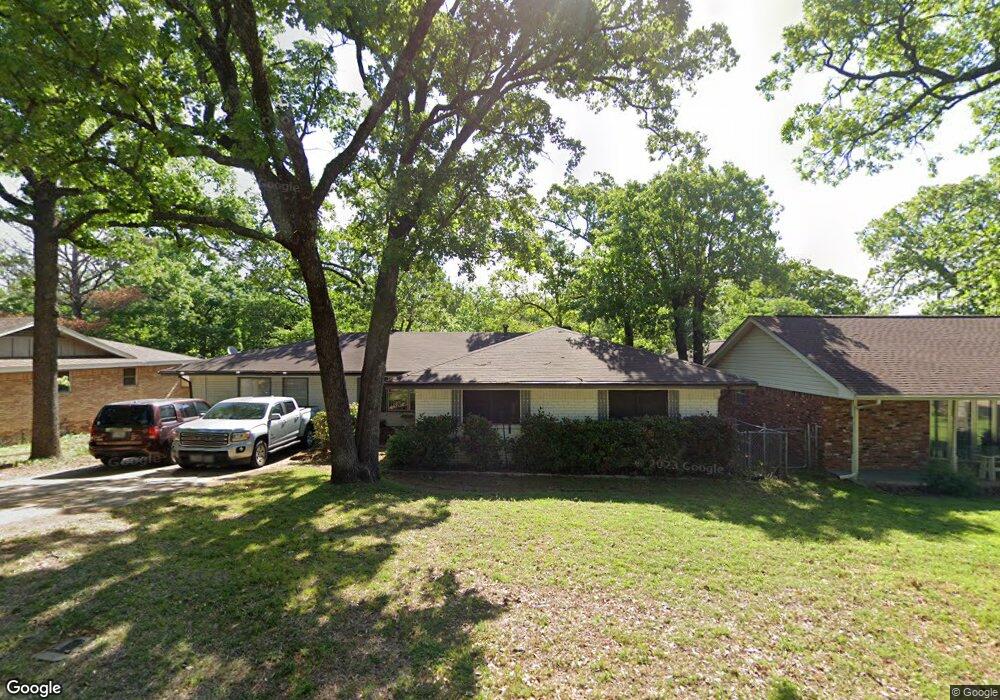
164 Circle Dr Denison, TX 75021
Estimated Value: $218,000 - $231,435
3
Beds
2
Baths
1,973
Sq Ft
$114/Sq Ft
Est. Value
About This Home
This home is located at 164 Circle Dr, Denison, TX 75021 and is currently estimated at $224,718, approximately $113 per square foot. 164 Circle Dr is a home located in Grayson County with nearby schools including Lamar Elementary School, Scott Middle School, and Denison High School.
Ownership History
Date
Name
Owned For
Owner Type
Purchase Details
Closed on
Dec 9, 2020
Sold by
Integrity Multifamily Llc
Bought by
Holman Kyle and Holman Kaitlyn Dyan
Current Estimated Value
Home Financials for this Owner
Home Financials are based on the most recent Mortgage that was taken out on this home.
Original Mortgage
$150,228
Outstanding Balance
$133,986
Interest Rate
2.8%
Mortgage Type
New Conventional
Estimated Equity
$90,732
Purchase Details
Closed on
Jun 5, 2018
Sold by
Greewood Kristyne and Greenwood Seth
Bought by
Integrity Multifamily Llc
Purchase Details
Closed on
Jul 1, 2013
Sold by
Mckoy Malcolm Gareth
Bought by
Greenwood Kristyne
Purchase Details
Closed on
May 5, 2004
Sold by
Mckoy Mary Jane and Wilburn Marijane
Bought by
Mckoy Malcolm Gareth
Create a Home Valuation Report for This Property
The Home Valuation Report is an in-depth analysis detailing your home's value as well as a comparison with similar homes in the area
Home Values in the Area
Average Home Value in this Area
Purchase History
| Date | Buyer | Sale Price | Title Company |
|---|---|---|---|
| Holman Kyle | -- | Red River Title Co | |
| Integrity Multifamily Llc | -- | Red River Title Co | |
| Greenwood Kristyne | -- | None Available | |
| Mckoy Malcolm Gareth | -- | -- |
Source: Public Records
Mortgage History
| Date | Status | Borrower | Loan Amount |
|---|---|---|---|
| Open | Holman Kyle | $150,228 |
Source: Public Records
Tax History
| Year | Tax Paid | Tax Assessment Tax Assessment Total Assessment is a certain percentage of the fair market value that is determined by local assessors to be the total taxable value of land and additions on the property. | Land | Improvement |
|---|---|---|---|---|
| 2025 | $3,494 | $199,188 | $40,444 | $158,744 |
| 2024 | $4,779 | $205,709 | $36,665 | $169,044 |
| 2023 | $3,063 | $192,248 | $0 | $0 |
| 2022 | $4,152 | $174,771 | $0 | $0 |
| 2021 | $4,007 | $158,883 | $18,179 | $140,704 |
| 2020 | $4,002 | $151,724 | $18,179 | $133,545 |
| 2019 | $4,094 | $148,779 | $12,256 | $136,523 |
| 2018 | $2,688 | $100,614 | $12,256 | $88,358 |
| 2017 | $2,464 | $88,091 | $12,256 | $75,835 |
| 2016 | $2,519 | $91,229 | $12,256 | $78,973 |
| 2015 | $1,857 | $81,843 | $10,315 | $71,528 |
| 2014 | $1,830 | $75,377 | $10,315 | $65,062 |
Source: Public Records
Map
Nearby Homes
- 125 Mark Dr
- 153 Circle Dr
- 1917 Avenue A
- 1905 S Lamar Ave
- 1903 S Lamar Ave
- 1901 S Lamar Ave
- 104 E Prospect St
- 2000 S Fannin Ave
- 2526 S Fannin Ave Unit 2600
- 509 W Coffin St
- 513 W Coffin St
- 501 W Collins St
- 1718 S Fannin Ave
- 614 Rice St
- 607 W Baker St
- 611 W Baker St
- 108 W Acheson St
- 214 E Acheson St
- 618 Star St
- 517 W Bullock St
Your Personal Tour Guide
Ask me questions while you tour the home.