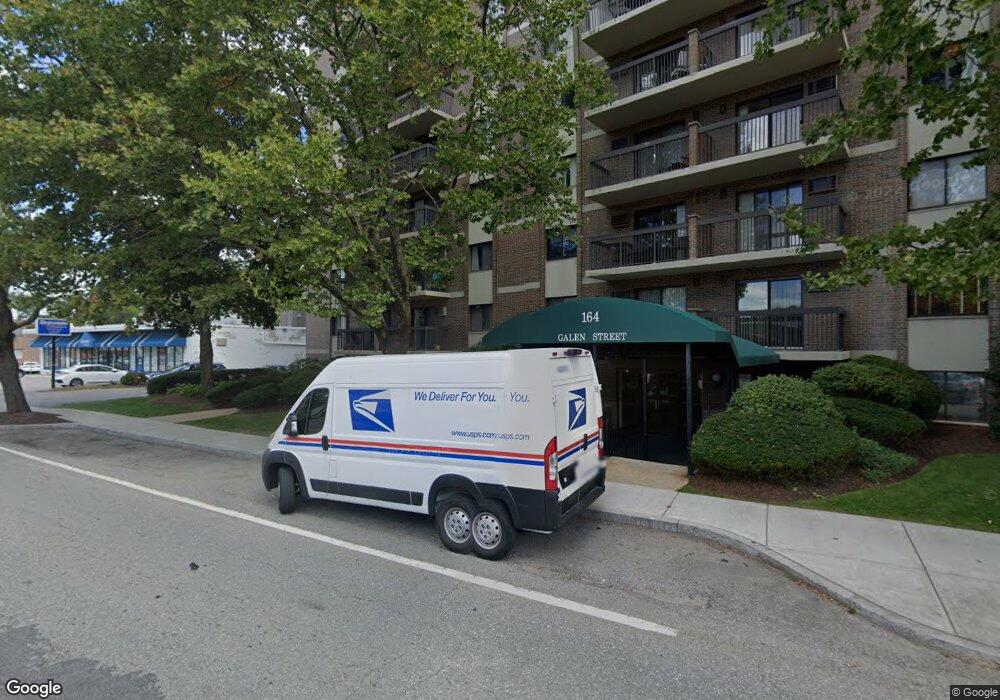
Newtown at Gateway Condominiums 164 Galen St Unit 82 Watertown, MA 02472
Newton Corner NeighborhoodEstimated Value: $395,108 - $404,000
1
Bed
1
Bath
670
Sq Ft
$596/Sq Ft
Est. Value
About This Home
This home is located at 164 Galen St Unit 82, Watertown, MA 02472 and is currently estimated at $399,527, approximately $596 per square foot. 164 Galen St Unit 82 is a home located in Middlesex County with nearby schools including Jackson Walnut Park School and Newton Country Day School.
Ownership History
Date
Name
Owned For
Owner Type
Purchase Details
Closed on
Feb 26, 2021
Sold by
Plante Theresa A
Bought by
Theresa Plante Lt
Current Estimated Value
Purchase Details
Closed on
Jan 25, 2019
Sold by
Plante Paul M and Plante Annette L
Bought by
Plante Theresa A
Purchase Details
Closed on
Jun 16, 2003
Sold by
Samafalov Boris and Samafalov Yelena
Bought by
Plante Paul M G and Plante Annette L
Purchase Details
Closed on
Jun 5, 2001
Sold by
Liiamaa Jonathan S and Liiamaa Jonathon S
Bought by
Samofalov Boris and Samofalov Yelena
Home Financials for this Owner
Home Financials are based on the most recent Mortgage that was taken out on this home.
Original Mortgage
$129,600
Interest Rate
7.09%
Mortgage Type
Purchase Money Mortgage
Purchase Details
Closed on
Mar 6, 1989
Sold by
Rich Paul R
Bought by
Liiamaa Jonathan S
Home Financials for this Owner
Home Financials are based on the most recent Mortgage that was taken out on this home.
Original Mortgage
$106,000
Interest Rate
10.63%
Mortgage Type
Purchase Money Mortgage
Create a Home Valuation Report for This Property
The Home Valuation Report is an in-depth analysis detailing your home's value as well as a comparison with similar homes in the area
Home Values in the Area
Average Home Value in this Area
Purchase History
| Date | Buyer | Sale Price | Title Company |
|---|---|---|---|
| Theresa Plante Lt | -- | None Available | |
| Plante Theresa A | -- | -- | |
| Plante Paul M G | $224,000 | -- | |
| Samofalov Boris | $162,000 | -- | |
| Liiamaa Jonathan S | $118,000 | -- |
Source: Public Records
Mortgage History
| Date | Status | Borrower | Loan Amount |
|---|---|---|---|
| Previous Owner | Samofalov Boris | $129,600 | |
| Previous Owner | Liiamaa Jonathan S | $106,000 |
Source: Public Records
Tax History Compared to Growth
Tax History
| Year | Tax Paid | Tax Assessment Tax Assessment Total Assessment is a certain percentage of the fair market value that is determined by local assessors to be the total taxable value of land and additions on the property. | Land | Improvement |
|---|---|---|---|---|
| 2025 | $4,554 | $389,900 | $0 | $389,900 |
| 2024 | $4,248 | $363,100 | $0 | $363,100 |
| 2023 | $4,849 | $357,100 | $0 | $357,100 |
| 2022 | $4,590 | $346,400 | $0 | $346,400 |
| 2021 | $4,243 | $346,400 | $0 | $346,400 |
| 2020 | $4,205 | $346,400 | $0 | $346,400 |
| 2019 | $3,371 | $261,700 | $0 | $261,700 |
| 2018 | $3,283 | $243,700 | $0 | $243,700 |
| 2017 | $3,385 | $243,700 | $0 | $243,700 |
| 2016 | $2,899 | $211,900 | $0 | $211,900 |
| 2015 | $3,185 | $211,900 | $0 | $211,900 |
| 2014 | $2,790 | $186,500 | $0 | $186,500 |
Source: Public Records
About Newtown at Gateway Condominiums
Map
Nearby Homes
- 164 Galen St Unit 88
- 164 Galen St Unit 65
- 10 Williams St Unit 39
- 10 Williams St Unit 56
- 30 Boyd St Unit 30
- 1 Channing St
- 34 Channing St Unit 1
- 34 Channing St Unit 2
- 15-17 Jewett Place Unit 2
- 169 Washington St Unit 7
- 66 Aldrich Rd Unit B
- 159 Washington St Unit 4
- 4 Remick Terrace
- 4 Remick Terrace Unit 4
- 12 Richardson St Unit 14
- 25 Ladd St Unit 25
- 25 Ladd St
- 180 Hunnewell Ave Unit 180
- 27 Ladd St Unit 27
- 14 N Beacon Ct
- 164 Galen St Unit 87
- 164 Galen St Unit 86
- 164 Galen St Unit 85
- 164 Galen St Unit 84
- 164 Galen St Unit 83
- 164 Galen St Unit 81
- 164 Galen St Unit 78
- 164 Galen St Unit 77
- 164 Galen St Unit 76
- 164 Galen St Unit 75
- 164 Galen St Unit 74
- 164 Galen St Unit 73
- 164 Galen St Unit 72
- 164 Galen St Unit 71
- 164 Galen St Unit 68
- 164 Galen St Unit 67
- 164 Galen St Unit 66
- 164 Galen St Unit 64
- 164 Galen St Unit 63
- 164 Galen St Unit 62