164 Hampton Creek Rd Commerce, GA 30529
Estimated Value: $322,000 - $350,000
3
Beds
2
Baths
1,734
Sq Ft
$191/Sq Ft
Est. Value
About This Home
This home is located at 164 Hampton Creek Rd, Commerce, GA 30529 and is currently estimated at $331,696, approximately $191 per square foot. 164 Hampton Creek Rd is a home with nearby schools including East Jackson Elementary School, East Jackson Middle School, and East Jackson Comprehensive High School.
Ownership History
Date
Name
Owned For
Owner Type
Purchase Details
Closed on
Feb 4, 2009
Sold by
Federal National Mortgage Association
Bought by
Chitwood Jerry P
Current Estimated Value
Home Financials for this Owner
Home Financials are based on the most recent Mortgage that was taken out on this home.
Original Mortgage
$107,308
Outstanding Balance
$66,238
Interest Rate
5.07%
Mortgage Type
New Conventional
Estimated Equity
$265,458
Purchase Details
Closed on
Jul 1, 2008
Sold by
Everhome Mtg Co
Bought by
Federal National Mtg Associati
Purchase Details
Closed on
Apr 21, 2003
Sold by
Martin Joseph A
Bought by
Martin Joseph A and Martin Teresa A
Purchase Details
Closed on
Sep 3, 2002
Sold by
Tuggle James P
Bought by
Regions Bank
Purchase Details
Closed on
Aug 21, 2001
Sold by
Wishbone Partners
Bought by
Tuggle James P
Create a Home Valuation Report for This Property
The Home Valuation Report is an in-depth analysis detailing your home's value as well as a comparison with similar homes in the area
Home Values in the Area
Average Home Value in this Area
Purchase History
| Date | Buyer | Sale Price | Title Company |
|---|---|---|---|
| Chitwood Jerry P | $103,100 | -- | |
| Federal National Mtg Associati | $100,478 | -- | |
| Everhome Mtg Co | $100,478 | -- | |
| Martin Joseph A | -- | -- | |
| Martin Joseph A | $113,000 | -- | |
| Regions Bank | -- | -- | |
| Tuggle James P | $24,000 | -- |
Source: Public Records
Mortgage History
| Date | Status | Borrower | Loan Amount |
|---|---|---|---|
| Open | Chitwood Jerry P | $107,308 |
Source: Public Records
Tax History
| Year | Tax Paid | Tax Assessment Tax Assessment Total Assessment is a certain percentage of the fair market value that is determined by local assessors to be the total taxable value of land and additions on the property. | Land | Improvement |
|---|---|---|---|---|
| 2024 | $871 | $111,400 | $20,000 | $91,400 |
| 2023 | $1,977 | $100,280 | $20,000 | $80,280 |
| 2022 | $1,487 | $83,960 | $20,000 | $63,960 |
| 2021 | $1,151 | $71,960 | $8,000 | $63,960 |
| 2020 | $535 | $49,160 | $8,000 | $41,160 |
| 2019 | $543 | $49,160 | $8,000 | $41,160 |
| 2018 | $1,493 | $47,120 | $8,000 | $39,120 |
| 2017 | $1,362 | $43,462 | $8,000 | $35,462 |
| 2016 | $1,370 | $43,462 | $8,000 | $35,462 |
| 2015 | $1,376 | $43,462 | $8,000 | $35,462 |
| 2014 | $1,308 | $41,112 | $8,000 | $33,112 |
| 2013 | -- | $40,218 | $8,000 | $32,218 |
Source: Public Records
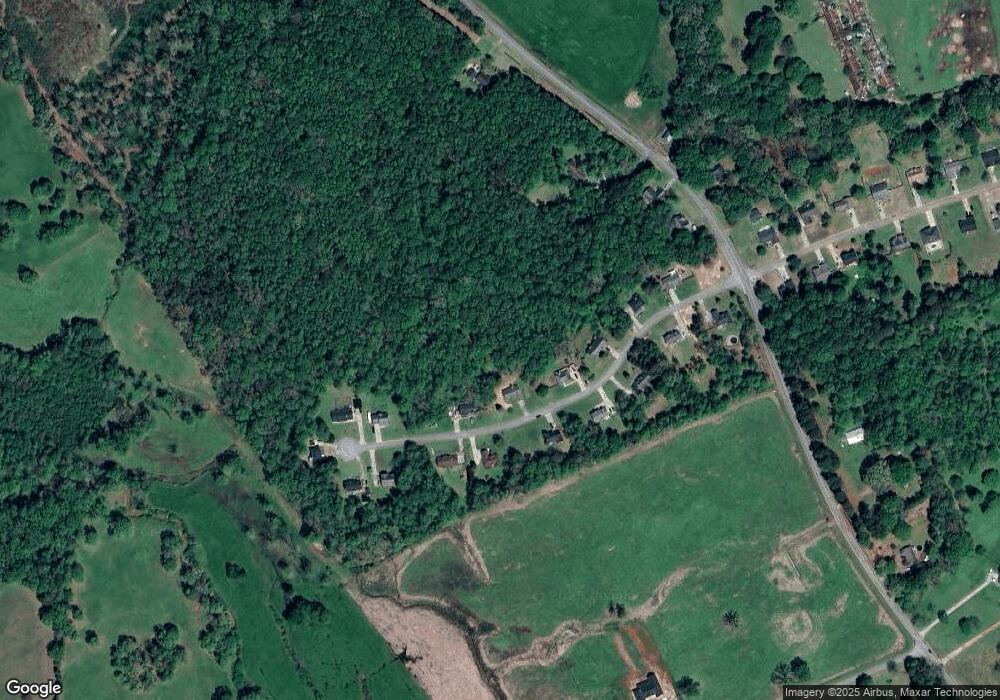
Map
Nearby Homes
- 4005 S Apple Valley Rd
- 411 Elwyn Barrett Rd
- 5304 S Apple Valley Rd
- 392 Flying Eagle Dr
- 374 Flying Eagle Dr
- 430 Flying Eagle Dr
- 410 Flying Eagle Dr
- 662 Maley Rd
- 708 Sheep Pasture Rd
- 0 Sheep Pasture Rd Unit 10643588
- 561 Oconee Ln
- 0 Rita Ridge Unit LOT 4
- 0 Rita Ridge Unit LOT 3
- 0 Rita Ridge Unit LOT 7
- 0 Rita Ridge Unit Lot 8
- 0 Rita Ridge Unit LOT 2
- 0 Rita Ridge Unit LOT 9
- 0 Rita Ridge Unit LOT 6
- 0 Rita Ridge Unit LOT 10
- 0 Rita Ridge Unit LOT 5
- 208 Hampton Creek Rd
- 161 Hampton Creek Rd
- 132 Hampton Creek Rd
- 191 Hampton Creek Rd
- 223 Hampton Creek Rd
- 129 Hampton Creek Rd
- 100 Hampton Creek Rd
- 103 Hampton Creek Rd
- 246 Hampton Creek Rd
- 85 Hampton Creek Rd
- 255 Hampton Creek Rd
- 62 Hampton Creek Rd
- 65 Hampton Creek Rd
- 65 Hampton Creek
- 274 Hampton Creek Rd
- 274 Hampton Creek
- 279 Hampton Creek Rd
- 36 Hampton Creek Rd
- 282 Hampton Creek Rd
- 19 Hampton Creek Rd
Your Personal Tour Guide
Ask me questions while you tour the home.