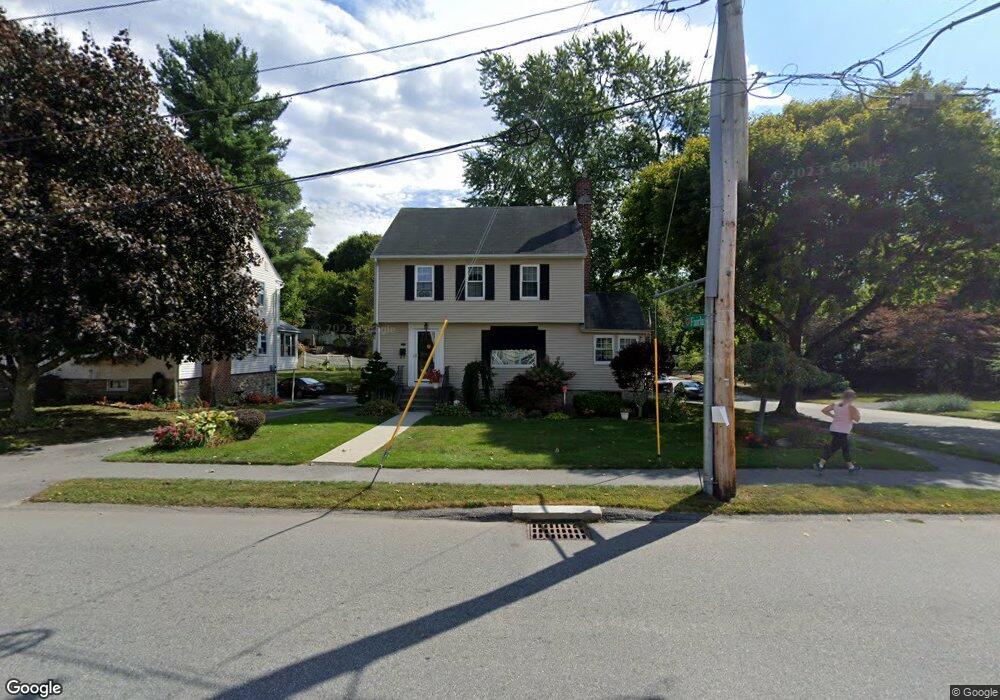
164 June St Worcester, MA 01602
Columbus Park NeighborhoodEstimated Value: $428,000 - $469,000
3
Beds
2
Baths
1,659
Sq Ft
$271/Sq Ft
Est. Value
About This Home
This home is located at 164 June St, Worcester, MA 01602 and is currently estimated at $450,316, approximately $271 per square foot. 164 June St is a home located in Worcester County with nearby schools including Chandler Magnet, Jacob Hiatt Magnet School, and May Street Elementary School.
Ownership History
Date
Name
Owned For
Owner Type
Purchase Details
Closed on
Jul 10, 2023
Sold by
Shivick Jane M
Bought by
Shivick Rt and Shivick
Current Estimated Value
Purchase Details
Closed on
Feb 22, 2002
Sold by
Cherrier Joy A
Bought by
Dickie Todd A and Shivick Jane M
Home Financials for this Owner
Home Financials are based on the most recent Mortgage that was taken out on this home.
Original Mortgage
$184,200
Interest Rate
7.08%
Mortgage Type
Purchase Money Mortgage
Create a Home Valuation Report for This Property
The Home Valuation Report is an in-depth analysis detailing your home's value as well as a comparison with similar homes in the area
Home Values in the Area
Average Home Value in this Area
Purchase History
| Date | Buyer | Sale Price | Title Company |
|---|---|---|---|
| Shivick Rt | -- | None Available | |
| Dickie Todd A | $189,900 | -- |
Source: Public Records
Mortgage History
| Date | Status | Borrower | Loan Amount |
|---|---|---|---|
| Previous Owner | Dickie Todd A | $186,500 | |
| Previous Owner | Dickie Todd A | $184,200 |
Source: Public Records
Tax History
| Year | Tax Paid | Tax Assessment Tax Assessment Total Assessment is a certain percentage of the fair market value that is determined by local assessors to be the total taxable value of land and additions on the property. | Land | Improvement |
|---|---|---|---|---|
| 2025 | $4,535 | $343,800 | $117,700 | $226,100 |
| 2024 | $4,465 | $324,700 | $117,700 | $207,000 |
| 2023 | $4,266 | $297,500 | $102,300 | $195,200 |
| 2022 | $3,906 | $256,800 | $81,900 | $174,900 |
| 2021 | $3,718 | $228,400 | $65,500 | $162,900 |
| 2020 | $3,623 | $213,100 | $65,500 | $147,600 |
| 2019 | $3,604 | $200,200 | $58,900 | $141,300 |
| 2018 | $3,595 | $190,100 | $58,900 | $131,200 |
| 2017 | $3,469 | $180,500 | $58,900 | $121,600 |
| 2016 | $3,382 | $164,100 | $42,800 | $121,300 |
| 2015 | $3,293 | $164,100 | $42,800 | $121,300 |
| 2014 | $3,207 | $164,100 | $42,800 | $121,300 |
Source: Public Records
Map
Nearby Homes
Your Personal Tour Guide
Ask me questions while you tour the home.