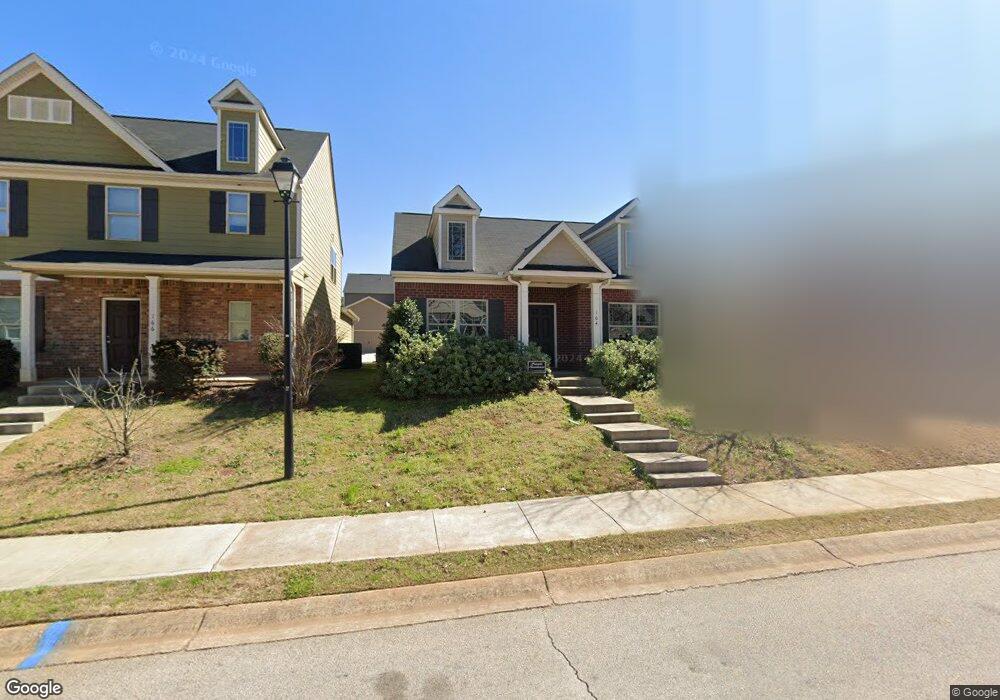
164 Magnaview Dr Unit 220 Mc Donough, GA 30253
Estimated Value: $273,813 - $296,000
3
Beds
2
Baths
1,481
Sq Ft
$193/Sq Ft
Est. Value
About This Home
This home is located at 164 Magnaview Dr Unit 220, Mc Donough, GA 30253 and is currently estimated at $285,703, approximately $192 per square foot. 164 Magnaview Dr Unit 220 is a home located in Henry County with nearby schools including Oakland Elementary School, Luella Middle School, and Luella High School.
Ownership History
Date
Name
Owned For
Owner Type
Purchase Details
Closed on
Jul 24, 2017
Sold by
Kerley Family Homes Llc
Bought by
Wright Thomas
Current Estimated Value
Home Financials for this Owner
Home Financials are based on the most recent Mortgage that was taken out on this home.
Original Mortgage
$150,058
Interest Rate
3.9%
Mortgage Type
VA
Purchase Details
Closed on
Dec 20, 2016
Sold by
Cottages Avalon Llc
Bought by
Kerley Fam Homes Llc
Home Financials for this Owner
Home Financials are based on the most recent Mortgage that was taken out on this home.
Original Mortgage
$118,000
Interest Rate
4.03%
Mortgage Type
Purchase Money Mortgage
Purchase Details
Closed on
May 31, 2016
Sold by
Reo Funding Solutions Iii Llc Iii
Bought by
Cottages Avalon Llc and C/O The Pacific Grp Inc
Purchase Details
Closed on
Dec 11, 2012
Sold by
Flagstar Bank Fsb
Bought by
Reo Funding Solutions Iii Llc
Create a Home Valuation Report for This Property
The Home Valuation Report is an in-depth analysis detailing your home's value as well as a comparison with similar homes in the area
Home Values in the Area
Average Home Value in this Area
Purchase History
| Date | Buyer | Sale Price | Title Company |
|---|---|---|---|
| Wright Thomas | $146,900 | -- | |
| Kerley Fam Homes Llc | $19,000 | -- | |
| Cottages Avalon Llc | $300,000 | -- | |
| Reo Funding Solutions Iii Llc | -- | -- | |
| Reo Funding Solutions Iii Llc | -- | -- | |
| Reo Funding Solutions Iii Llc | $783,100 | -- |
Source: Public Records
Mortgage History
| Date | Status | Borrower | Loan Amount |
|---|---|---|---|
| Open | Wright Thomas | $150,058 | |
| Previous Owner | Kerley Fam Homes Llc | $118,000 |
Source: Public Records
Tax History Compared to Growth
Tax History
| Year | Tax Paid | Tax Assessment Tax Assessment Total Assessment is a certain percentage of the fair market value that is determined by local assessors to be the total taxable value of land and additions on the property. | Land | Improvement |
|---|---|---|---|---|
| 2024 | $977 | $112,520 | $14,000 | $98,520 |
| 2023 | $687 | $128,800 | $14,000 | $114,800 |
| 2022 | $819 | $94,600 | $14,000 | $80,600 |
| 2021 | $806 | $73,680 | $14,000 | $59,680 |
| 2020 | $803 | $69,160 | $10,600 | $58,560 |
| 2019 | $833 | $64,320 | $10,600 | $53,720 |
| 2018 | $815 | $58,560 | $10,000 | $48,560 |
| 2016 | $275 | $6,800 | $6,800 | $0 |
| 2015 | $206 | $3,960 | $3,960 | $0 |
| 2014 | $157 | $3,800 | $3,800 | $0 |
Source: Public Records
Map
Nearby Homes
- 251 Magnaview Dr
- 212 Magnaview Dr
- 231 Magnaview Dr
- 219 Magnaview Dr
- 136 Paulownia Cir
- 400 Paulownia Cir
- 5060 Pioneer Pkwy
- 789 Galveston Way
- 5045 Pioneer Pkwy
- 109 Paulownia Cir
- 853 Parkside Place Ave
- 505 Mariposa Ln
- 840 Royal Red Ct
- 121 Parkview Place Dr
- 125 Parkview Place Dr
- 129 Parkview Place Dr
- 173 Parkview Place Dr
- 169 Parkview Place Dr
- 259 Paulownia Cir
- 157 Parkview Place Dr
- 164 Magnaview Dr
- 166 Magnaview Dr
- 166 Magnaview Dr Unit 219
- 166 Magnaview Dr
- 162 Magnaview Dr Unit 221
- 162 Magnaview Dr
- 168 Magnaview Dr Unit 218
- 168 Magnaview Dr
- 160 Magnaview Dr Unit 222
- 160 Magnaview Dr
- 728 Galveston Way Unit 244
- 728 Galveston Way
- 730 Galveston Way Unit 243
- 730 Galveston Way
- 170 Magnaview Dr
- 170 Magnaview Dr Unit 217
- 170 Magnaview Dr
- 158 Magnaview Dr Unit 223
- 158 Magnaview Dr
- 726 Galveston Way Unit 245