

164 Main St Fairhaven, MA 02719
Oxford NeighborhoodEstimated payment $4,986/month
Highlights
- Marina
- Granite Flooring
- 0.59 Acre Lot
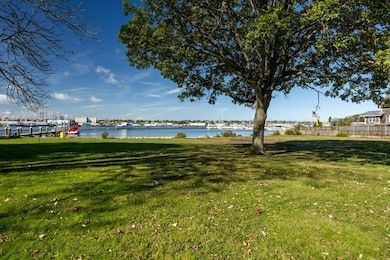
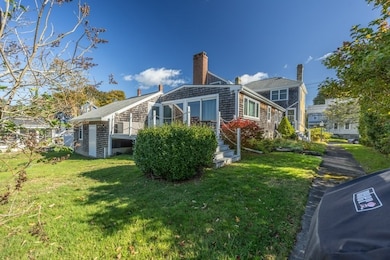
- Harbor Views
- Waterfront
- Colonial Architecture
About This Home
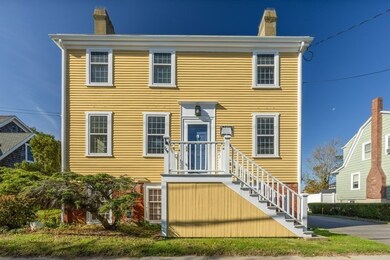
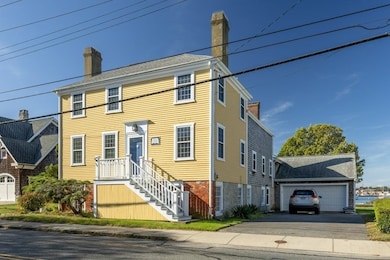
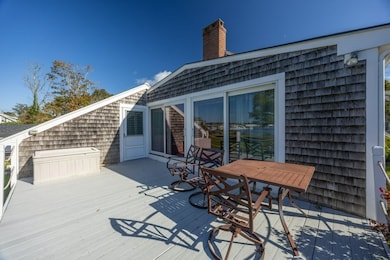
Historic Charm Meets Modern Comfort – Circa 1780. Step back in time without sacrificing modern comfort in this beautifully preserved and thoughtfully updated antique home, originally built in 1780 and relocated to its current site in 1820. Rich in history and character, this three-bedroom, two full, and two half-bath residence seamlessly blends 18th-century craftsmanship with 21st-century amenities. Inside, you'll find three fireplaces and period details that speak to the home's storied past. The updated high-efficiency, multi-zone heating system ensures year-round comfort, while the freshly painted exterior and meticulously maintained interior showcase the care and pride of ownership poured into the property. A spacious sun deck offers sweeping views of the harbor—perfect for morning coffee or evening entertaining. The home also features a two-car garage, a rare and valuable convenience in a home of this era.
Home Details
Home Type
- Single Family
Est. Annual Taxes
- $7,223
Year Built
- Built in 1780
Lot Details
- 0.59 Acre Lot
- Waterfront
- Gentle Sloping Lot
- Cleared Lot
- Property is zoned RA
Parking
- 2 Car Attached Garage
- Garage Door Opener
- Off-Street Parking
Property Views
- Harbor
- Scenic Vista
Home Design
- Colonial Architecture
- Antique Architecture
- Stone Foundation
- Frame Construction
- Shingle Roof
Interior Spaces
- 3 Fireplaces
- Insulated Windows
- Window Screens
- Sitting Room
Kitchen
- Range with Range Hood
- Plumbed For Ice Maker
- Dishwasher
- Disposal
Flooring
- Wood
- Carpet
- Granite
- Vinyl
Bedrooms and Bathrooms
- 3 Bedrooms
- Primary bedroom located on second floor
Laundry
- Laundry on main level
- Dryer
- Washer
Partially Finished Basement
- Basement Fills Entire Space Under The House
- Interior Basement Entry
- Garage Access
- Block Basement Construction
Home Security
- Storm Windows
- Storm Doors
Eco-Friendly Details
- ENERGY STAR Qualified Equipment for Heating
- Energy-Efficient Thermostat
Outdoor Features
- Bulkhead
- Deck
- Rain Gutters
Location
- Property is near public transit
Schools
- Wood Elementary School
- Hastings Middle School
- FHS High School
Utilities
- No Cooling
- Heating System Uses Natural Gas
- Baseboard Heating
- Tankless Water Heater
- Gas Water Heater
Listing and Financial Details
- Assessor Parcel Number M:000012 L:00007 S:,3279439
Community Details
Overview
- No Home Owners Association
Amenities
- Shops
- Coin Laundry
Recreation
- Marina
- Park
- Bike Trail
Map
Home Values in the Area
Average Home Value in this Area
Tax History
| Year | Tax Paid | Tax Assessment Tax Assessment Total Assessment is a certain percentage of the fair market value that is determined by local assessors to be the total taxable value of land and additions on the property. | Land | Improvement |
|---|---|---|---|---|
| 2025 | $7,223 | $775,000 | $463,100 | $311,900 |
| 2024 | $6,890 | $746,500 | $440,900 | $305,600 |
| 2023 | $6,519 | $655,200 | $378,400 | $276,800 |
| 2022 | $6,503 | $636,300 | $378,400 | $257,900 |
| 2021 | $6,563 | $581,300 | $363,100 | $218,200 |
| 2020 | $6,429 | $581,300 | $363,100 | $218,200 |
| 2019 | $5,938 | $508,800 | $300,700 | $208,100 |
| 2018 | $6,045 | $497,400 | $300,700 | $196,700 |
| 2017 | $5,892 | $489,400 | $300,700 | $188,700 |
| 2016 | $5,664 | $465,000 | $300,700 | $164,300 |
| 2015 | $5,269 | $433,700 | $273,000 | $160,700 |
Property History
| Date | Event | Price | List to Sale | Price per Sq Ft |
|---|---|---|---|---|
| 11/13/2025 11/13/25 | For Sale | $830,000 | 0.0% | $274 / Sq Ft |
| 10/29/2025 10/29/25 | Pending | -- | -- | -- |
| 10/28/2025 10/28/25 | Pending | -- | -- | -- |
| 10/14/2025 10/14/25 | For Sale | $830,000 | -- | $274 / Sq Ft |
Purchase History
| Date | Type | Sale Price | Title Company |
|---|---|---|---|
| Deed | $191,000 | -- |
Mortgage History
| Date | Status | Loan Amount | Loan Type |
|---|---|---|---|
| Open | $143,000 | No Value Available | |
| Closed | $145,000 | No Value Available | |
| Closed | $152,800 | Purchase Money Mortgage | |
| Previous Owner | $143,200 | No Value Available |
Source: MLS Property Information Network (MLS PIN)
MLS Number: 73443129
APN: FAIR-000012-000000-000007
Disclaimer: Certain information contained herein is derived from information provided by parties other than Homes.com. All information provided is deemed reliable, but is not guaranteed to be accurate and should be independently verified.
![]() The property listing data and information, or the Images, set forth herein were provided to MLS Property Information Network, Inc. from third party sources, including sellers, lessors and public records, and were compiled by MLS Property Information Network, Inc. The property listing data and information, and the Images, are for the personal, non-commercial use of consumers having a good faith interest in purchasing or leasing listed properties of the type displayed to them and may not be used for any purpose other than to identify prospective properties which such consumers may have a good faith interest in purchasing or leasing. MLS Property Information Network, Inc. and its subscribers disclaim any and all representations and warranties as to the accuracy of the property listing data and information, or as to the accuracy of any of the Images, set forth herein.
The property listing data and information, or the Images, set forth herein were provided to MLS Property Information Network, Inc. from third party sources, including sellers, lessors and public records, and were compiled by MLS Property Information Network, Inc. The property listing data and information, and the Images, are for the personal, non-commercial use of consumers having a good faith interest in purchasing or leasing listed properties of the type displayed to them and may not be used for any purpose other than to identify prospective properties which such consumers may have a good faith interest in purchasing or leasing. MLS Property Information Network, Inc. and its subscribers disclaim any and all representations and warranties as to the accuracy of the property listing data and information, or as to the accuracy of any of the Images, set forth herein.
