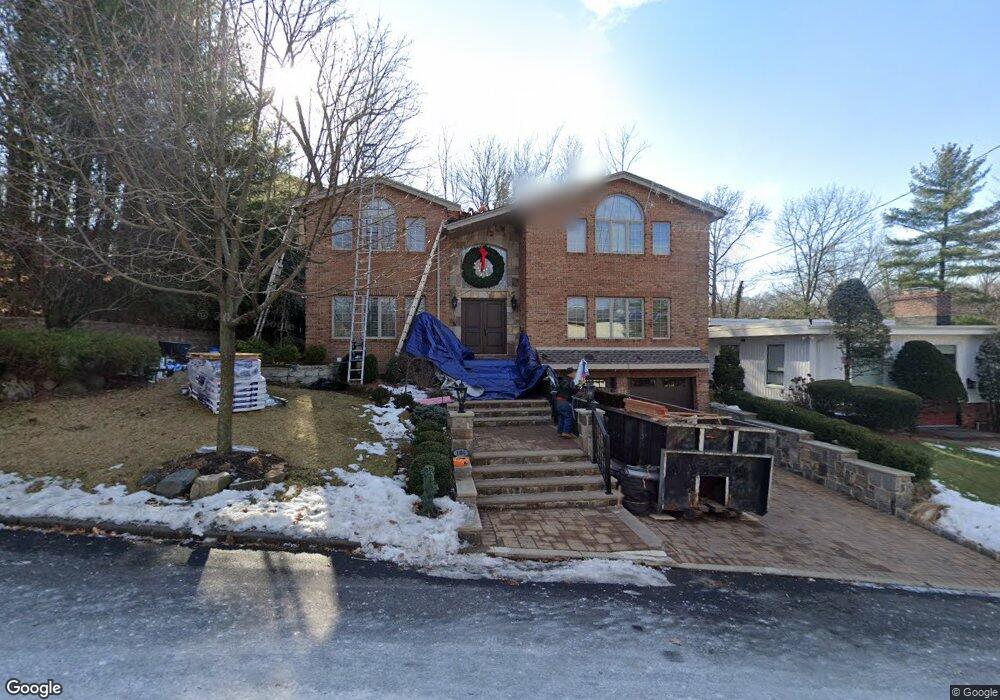
164 Middlesex Ave Englewood Cliffs, NJ 07632
Estimated Value: $1,780,515 - $2,284,000
--
Bed
--
Bath
3,857
Sq Ft
$514/Sq Ft
Est. Value
About This Home
This home is located at 164 Middlesex Ave, Englewood Cliffs, NJ 07632 and is currently estimated at $1,982,129, approximately $513 per square foot. 164 Middlesex Ave is a home located in Bergen County with nearby schools including North Cliff Elementary School, Upper School Elementary School, and Dwight-Englewood School.
Ownership History
Date
Name
Owned For
Owner Type
Purchase Details
Closed on
Feb 11, 2011
Sold by
Ycre Louis R and Ycre Patricia E
Bought by
Theodorakos Vasilios G and Theodorakos Christina
Current Estimated Value
Home Financials for this Owner
Home Financials are based on the most recent Mortgage that was taken out on this home.
Original Mortgage
$880,000
Outstanding Balance
$603,591
Interest Rate
4.83%
Mortgage Type
Purchase Money Mortgage
Estimated Equity
$1,378,538
Purchase Details
Closed on
Jun 6, 1997
Sold by
Bruni Eugene and Bruni Lena
Bought by
Yore Louis R and Donohue Patricia E
Home Financials for this Owner
Home Financials are based on the most recent Mortgage that was taken out on this home.
Original Mortgage
$400,000
Interest Rate
7.97%
Create a Home Valuation Report for This Property
The Home Valuation Report is an in-depth analysis detailing your home's value as well as a comparison with similar homes in the area
Home Values in the Area
Average Home Value in this Area
Purchase History
| Date | Buyer | Sale Price | Title Company |
|---|---|---|---|
| Theodorakos Vasilios G | $1,100,000 | -- | |
| Yore Louis R | $710,000 | -- |
Source: Public Records
Mortgage History
| Date | Status | Borrower | Loan Amount |
|---|---|---|---|
| Open | Theodorakos Vasilios G | $880,000 | |
| Previous Owner | Yore Louis R | $400,000 |
Source: Public Records
Tax History Compared to Growth
Tax History
| Year | Tax Paid | Tax Assessment Tax Assessment Total Assessment is a certain percentage of the fair market value that is determined by local assessors to be the total taxable value of land and additions on the property. | Land | Improvement |
|---|---|---|---|---|
| 2025 | $15,760 | $1,364,500 | $585,000 | $779,500 |
| 2024 | $15,569 | $1,364,500 | $585,000 | $779,500 |
| 2023 | $15,323 | $1,364,500 | $585,000 | $779,500 |
| 2022 | $15,323 | $1,364,500 | $585,000 | $779,500 |
| 2021 | $11,778 | $1,364,500 | $585,000 | $779,500 |
| 2020 | $15,705 | $1,364,500 | $585,000 | $779,500 |
| 2019 | $14,750 | $1,364,500 | $585,000 | $779,500 |
| 2018 | $14,232 | $1,364,500 | $585,000 | $779,500 |
| 2017 | $13,618 | $1,364,500 | $585,000 | $779,500 |
| 2016 | $13,358 | $1,364,500 | $585,000 | $779,500 |
| 2015 | $12,690 | $1,364,500 | $585,000 | $779,500 |
| 2014 | $11,871 | $1,364,500 | $585,000 | $779,500 |
Source: Public Records
Map
Nearby Homes