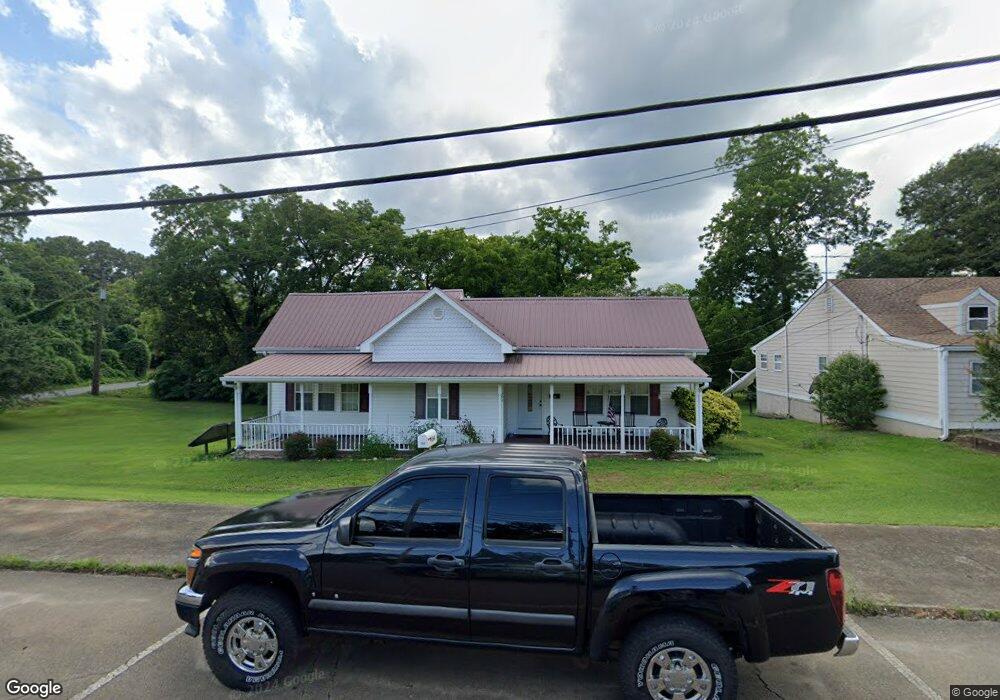
164 S Main St Jasper, GA 30143
Estimated Value: $339,987 - $423,000
--
Bed
1
Bath
1,552
Sq Ft
$248/Sq Ft
Est. Value
About This Home
This home is located at 164 S Main St, Jasper, GA 30143 and is currently estimated at $385,497, approximately $248 per square foot. 164 S Main St is a home located in Pickens County with nearby schools including Harmony Elementary School, Pickens County Middle School, and Pickens County High School.
Ownership History
Date
Name
Owned For
Owner Type
Purchase Details
Closed on
Jun 12, 2006
Sold by
Aicher Robert Donald
Bought by
Aicher Anna F
Current Estimated Value
Purchase Details
Closed on
Dec 30, 2004
Sold by
Card Christi W
Bought by
Card Christi W and Card Michael D
Home Financials for this Owner
Home Financials are based on the most recent Mortgage that was taken out on this home.
Original Mortgage
$160,000
Outstanding Balance
$80,033
Interest Rate
5.61%
Mortgage Type
New Conventional
Estimated Equity
$305,464
Purchase Details
Closed on
Sep 18, 2000
Sold by
Woodring Mary Edith
Bought by
Card Christi W
Purchase Details
Closed on
Oct 14, 1998
Sold by
Pool Martha Keith
Bought by
Woodring Mary Edith
Purchase Details
Closed on
Sep 23, 1991
Sold by
Pool Martha Keith
Bought by
Woodring Mary Edith
Purchase Details
Closed on
Jan 1, 1960
Bought by
Pool Martha K
Create a Home Valuation Report for This Property
The Home Valuation Report is an in-depth analysis detailing your home's value as well as a comparison with similar homes in the area
Home Values in the Area
Average Home Value in this Area
Purchase History
| Date | Buyer | Sale Price | Title Company |
|---|---|---|---|
| Aicher Anna F | -- | -- | |
| Card Christi W | -- | -- | |
| Card Christi W | -- | -- | |
| Card Christi W | $54,000 | -- | |
| Woodring Mary Edith | $25,000 | -- | |
| Woodring Mary Edith | -- | -- | |
| Pool Martha K | -- | -- |
Source: Public Records
Mortgage History
| Date | Status | Borrower | Loan Amount |
|---|---|---|---|
| Open | Card Christi W | $160,000 |
Source: Public Records
Tax History Compared to Growth
Tax History
| Year | Tax Paid | Tax Assessment Tax Assessment Total Assessment is a certain percentage of the fair market value that is determined by local assessors to be the total taxable value of land and additions on the property. | Land | Improvement |
|---|---|---|---|---|
| 2024 | $2,888 | $113,482 | $50,030 | $63,452 |
| 2023 | $2,950 | $113,482 | $50,030 | $63,452 |
| 2022 | $1,899 | $93,388 | $50,030 | $43,358 |
| 2021 | $1,973 | $90,572 | $50,030 | $40,542 |
| 2020 | $2,033 | $90,572 | $50,030 | $40,542 |
| 2019 | $2,079 | $90,572 | $50,030 | $40,542 |
| 2018 | $2,099 | $90,572 | $50,030 | $40,542 |
| 2017 | $2,133 | $90,572 | $50,030 | $40,542 |
| 2016 | $2,167 | $90,572 | $50,030 | $40,542 |
| 2015 | $2,507 | $107,249 | $66,706 | $40,542 |
| 2014 | $2,512 | $107,249 | $66,706 | $40,542 |
| 2013 | -- | $107,248 | $66,706 | $40,542 |
Source: Public Records
Map
Nearby Homes
- 288 Blazingstar Trail
- 261 Deerberry Dr
- 007 Dottie Ln
- 006 Dottie Ln
- 005 Dottie Ln
- 004 Dottie Ln
- 003 Dottie Ln
- 002 Dottie Ln
- 001 Dottie Ln
- 287 Lookout Valley Trail
- 72 W Sellers St
- 68 W Church St
- 60 Mcwhorter St
- 8266 Cox Mountain Dr
- 147 Elizabeth St
- 240 Jacobs Way Unit F
- 165 Towne Villas Dr Unit 20
- 157 Towne Villas Dr Unit 18
- 28 Lincoln St
- 0 Mulberry Cir Unit 7660881
- 0 Mineral Springs Rd N
- 0 Mineral Springs Rd N Unit 7468098
- 0 Mineral Springs Rd N Unit 7564682
- 0 Mineral Springs Rd N Unit 7393412
- 0 Mineral Springs Rd N Unit 7340791
- 0 Mineral Springs Rd N Unit 3090316
- 0 Mineral Springs Rd N Unit 3264949
- 0 Mineral Springs Rd N Unit 7470409
- 120 S Main St
- 147 S Main St
- 175 S Main St
- 200 S Main St
- S S Richards St
- 108 S Richards St
- 115 S Main St
- 115 S Main St Unit 2
- 80 S Main St
- 103 S Main St
- 51 Effie St
- 226 S Main St