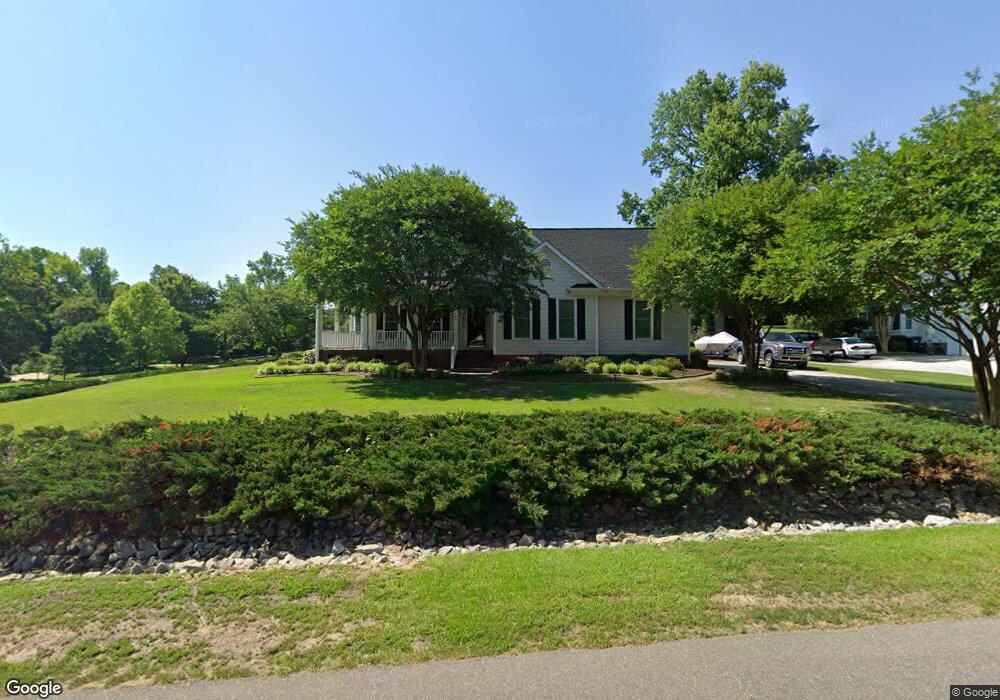
164 St Jiles Dr Clayton, NC 27520
42 West NeighborhoodEstimated Value: $476,000 - $542,000
3
Beds
3
Baths
2,569
Sq Ft
$197/Sq Ft
Est. Value
About This Home
This home is located at 164 St Jiles Dr, Clayton, NC 27520 and is currently estimated at $504,850, approximately $196 per square foot. 164 St Jiles Dr is a home located in Johnston County with nearby schools including Cleveland Elementary School, Cleveland Middle School, and Cleveland High School.
Ownership History
Date
Name
Owned For
Owner Type
Purchase Details
Closed on
May 18, 2017
Sold by
Butts James L and Butts Terrie
Bought by
Lovering Gary and Mccauley Karen
Current Estimated Value
Home Financials for this Owner
Home Financials are based on the most recent Mortgage that was taken out on this home.
Original Mortgage
$251,400
Outstanding Balance
$49,111
Interest Rate
3.97%
Mortgage Type
New Conventional
Estimated Equity
$455,739
Purchase Details
Closed on
Feb 27, 2013
Sold by
Butts James L and Butts Terrie
Bought by
Butts James L and Butts Terrie
Home Financials for this Owner
Home Financials are based on the most recent Mortgage that was taken out on this home.
Original Mortgage
$175,200
Interest Rate
3.56%
Mortgage Type
New Conventional
Purchase Details
Closed on
Nov 14, 2002
Sold by
Butts James L
Bought by
Butts James
Create a Home Valuation Report for This Property
The Home Valuation Report is an in-depth analysis detailing your home's value as well as a comparison with similar homes in the area
Home Values in the Area
Average Home Value in this Area
Purchase History
| Date | Buyer | Sale Price | Title Company |
|---|---|---|---|
| Lovering Gary | $282,500 | Trusttitle Insurance Company | |
| Butts James L | -- | None Available | |
| Butts James | -- | -- |
Source: Public Records
Mortgage History
| Date | Status | Borrower | Loan Amount |
|---|---|---|---|
| Open | Lovering Gary | $251,400 | |
| Previous Owner | Butts James L | $175,200 |
Source: Public Records
Tax History Compared to Growth
Tax History
| Year | Tax Paid | Tax Assessment Tax Assessment Total Assessment is a certain percentage of the fair market value that is determined by local assessors to be the total taxable value of land and additions on the property. | Land | Improvement |
|---|---|---|---|---|
| 2025 | $2,847 | $443,160 | $100,000 | $343,160 |
| 2024 | $2,431 | $293,670 | $62,000 | $231,670 |
| 2023 | $2,353 | $293,670 | $62,000 | $231,670 |
| 2022 | $2,489 | $293,670 | $62,000 | $231,670 |
| 2021 | $2,492 | $293,670 | $62,000 | $231,670 |
| 2020 | $2,532 | $293,670 | $62,000 | $231,670 |
| 2019 | $2,445 | $293,670 | $62,000 | $231,670 |
| 2018 | $2,056 | $241,220 | $52,300 | $188,920 |
| 2017 | $2,056 | $241,220 | $52,300 | $188,920 |
| 2016 | $2,056 | $241,220 | $52,300 | $188,920 |
| 2015 | $1,963 | $230,300 | $52,300 | $178,000 |
| 2014 | $1,963 | $230,300 | $52,300 | $178,000 |
Source: Public Records
Map
Nearby Homes
- 133 Aleah Ct
- 120 Kelsey Ct
- 2004 Spring Valley Dr
- 116 Bornean Dr
- 83 Artic Cir
- Raleigh Plan at Ford Meadows
- Stanley Plan at Ford Meadows
- Ellerbe Plan at Ford Meadows
- Davidson Plan at Ford Meadows
- Drexel Plan at Ford Meadows
- Graham Plan at Ford Meadows
- Cypress Plan at Ford Meadows
- Avery Plan at Ford Meadows
- Wescott Plan at Ford Meadows
- 101 Water Lily Cir
- 150 Steppe Way
- 143 Steppe Way
- 240 David Ln
- 46 Steppe Way
- 36 Steppe Way
- 164 Saint Jiles Dr
- 154 Saint Jiles Dr
- 107 Austin Pond Rd
- 100 Austin Pond Rd
- 144 Saint Jiles Dr
- 144 St Jiles Dr
- 116 Austin Pond Rd
- 157 St Jiles Dr
- 157 Saint Jiles Dr
- 171 Saint Jiles Dr
- 93 Austin Pond Rd
- 143 St Jiles Dr
- 190 St Jiles Dr
- 190 Saint Jiles Dr
- 134 St Jiles Dr
- 134 Saint Jiles Dr
- 143 Saint Jiles Dr
- 181 Saint Jiles Dr
- 78 Austin Pond Rd