Estimated Value: $483,567 - $567,000
3
Beds
2
Baths
1,446
Sq Ft
$352/Sq Ft
Est. Value
About This Home
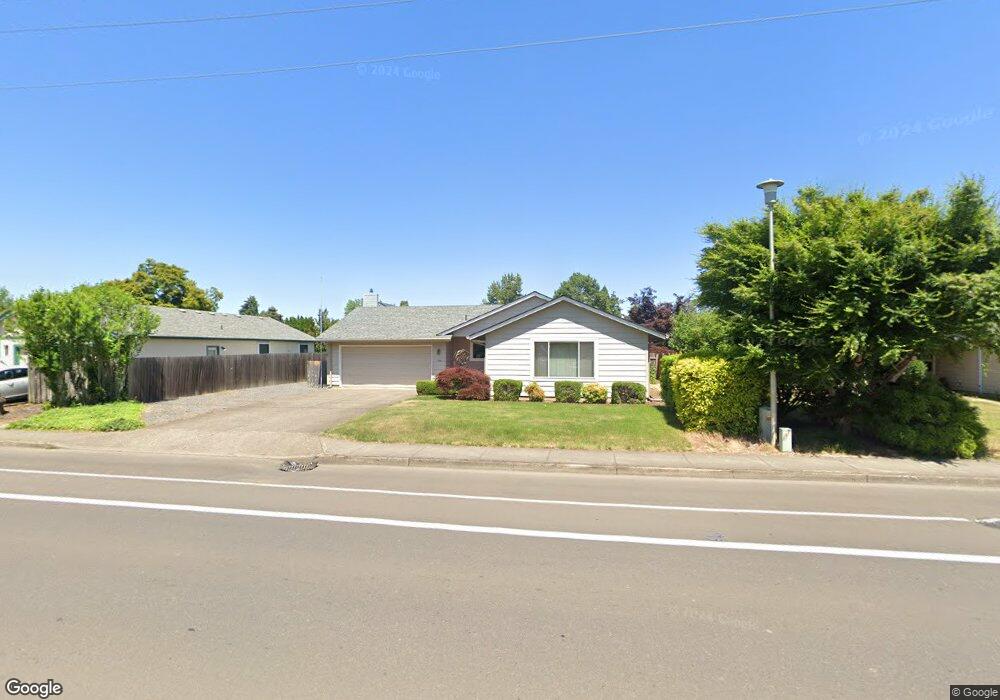
This home is located at 164 SW 13th Ave, Canby, OR 97013 and is currently estimated at $509,392, approximately $352 per square foot. 164 SW 13th Ave is a home located in Clackamas County with nearby schools including Josefa L. Sambrano Elementary School, Philander Lee Elementary School, and Baker Prairie Middle School.
Ownership History
Date
Name
Owned For
Owner Type
Purchase Details
Closed on
Sep 4, 2012
Sold by
Pyle Jack E and Pyle Ellen M
Bought by
Chambers Donald
Current Estimated Value
Home Financials for this Owner
Home Financials are based on the most recent Mortgage that was taken out on this home.
Original Mortgage
$267,750
Outstanding Balance
$183,908
Interest Rate
3.49%
Mortgage Type
Reverse Mortgage Home Equity Conversion Mortgage
Estimated Equity
$325,484
Purchase Details
Closed on
Mar 8, 2012
Sold by
Pyle Jack and Pyle Donna E
Bought by
Pyle Jack E and Pyle Ellen M
Purchase Details
Closed on
Aug 2, 2001
Sold by
Pyle Jack E
Bought by
Pyle Jack and Pyle Donna E
Purchase Details
Closed on
Jun 7, 1999
Sold by
Haines Mont L and Haines Vickie L
Bought by
Pyle Jack E
Purchase Details
Closed on
Mar 26, 1997
Sold by
Hansen Douglas S and Hansen Debbie L
Bought by
Haines Mont L and Haines Vickie L
Home Financials for this Owner
Home Financials are based on the most recent Mortgage that was taken out on this home.
Original Mortgage
$140,491
Interest Rate
7.63%
Mortgage Type
FHA
Create a Home Valuation Report for This Property
The Home Valuation Report is an in-depth analysis detailing your home's value as well as a comparison with similar homes in the area
Home Values in the Area
Average Home Value in this Area
Purchase History
| Date | Buyer | Sale Price | Title Company |
|---|---|---|---|
| Chambers Donald | $178,500 | First American | |
| Pyle Jack E | $189,000 | Chicago Title Company Of Or | |
| Pyle Jack | $20,000 | Chicago Title Insurance Co | |
| Pyle Jack E | $151,000 | Chicago Title Insurance Co | |
| Haines Mont L | $142,500 | Chicago Title |
Source: Public Records
Mortgage History
| Date | Status | Borrower | Loan Amount |
|---|---|---|---|
| Open | Chambers Donald | $267,750 | |
| Previous Owner | Haines Mont L | $140,491 |
Source: Public Records
Tax History Compared to Growth
Tax History
| Year | Tax Paid | Tax Assessment Tax Assessment Total Assessment is a certain percentage of the fair market value that is determined by local assessors to be the total taxable value of land and additions on the property. | Land | Improvement |
|---|---|---|---|---|
| 2025 | $4,661 | $263,081 | -- | -- |
| 2024 | $4,530 | $255,419 | -- | -- |
| 2023 | $4,530 | $247,980 | $0 | $0 |
| 2022 | $4,167 | $240,758 | $0 | $0 |
| 2021 | $4,013 | $233,746 | $0 | $0 |
| 2020 | $3,941 | $226,938 | $0 | $0 |
| 2019 | $3,753 | $220,329 | $0 | $0 |
| 2018 | $3,669 | $213,912 | $0 | $0 |
| 2017 | $3,576 | $207,682 | $0 | $0 |
| 2016 | $3,457 | $201,633 | $0 | $0 |
| 2015 | $3,338 | $195,760 | $0 | $0 |
| 2014 | $3,242 | $190,058 | $0 | $0 |
Source: Public Records
Map
Nearby Homes
- 201 SE 16th Ave
- 1491 S Fir St Unit 18
- 1487 S Fir St Unit Lot17
- 1485 S Fir St Unit Lot 16
- 1400 S Elm St Unit 91
- 1409 S Maple St
- 331 SE 9th Ave
- 476 SW 15th Ave
- 442 SW 15th Ave Unit 15
- 448 SW 15th Ave Unit 14
- 452 SW 15th Ave Unit 13
- 1157 SE 18th Ave
- 1146 SE 18th Ave
- 1175 SE 18th Ave
- 1165 SE 18th Ave
- 1156 SE 18th Ave
- 1196 SE 18th Ave
- 1197 SE 18th Ave
- 1150 SE 18th Ave
- The Hillmont Plan at Mark's Place at Tofte Farms
- 180 SW 13th Ave
- 152 SW 13th Ave
- 165 SW 12th Ave
- 149 SW 12th Ave
- 181 SW 12th Ave
- 181 NW 12th Ave
- 1278 S Holly St
- 138 SW 13th Ave
- 1222 S Holly St
- 135 SW 12th Ave
- 122 SW 13th Ave
- 170 SW 12th Ave
- 156 SW 12th Ave
- 186 SW 12th Ave
- 1275 S Holly St
- 117 SW 12th Ave
- 1177 S Ivy Ct
- 110 SW 13th Ave
- 1225 S Holly St
- 200 SW 12th Ave