Estimated Value: $164,000 - $222,485
2
Beds
1
Bath
1,792
Sq Ft
$112/Sq Ft
Est. Value
About This Home
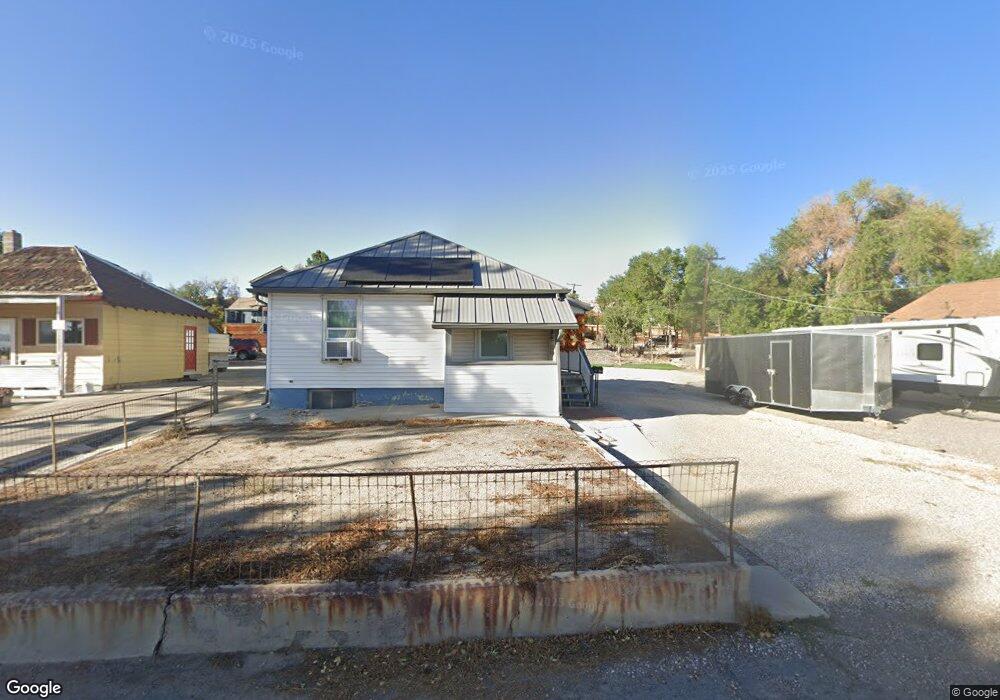
This home is located at 164 W 200 N, Price, UT 84501 and is currently estimated at $200,371, approximately $111 per square foot. 164 W 200 N is a home located in Carbon County with nearby schools including Castle Heights School, Mont Harmon Junior High School, and Carbon High School.
Ownership History
Date
Name
Owned For
Owner Type
Purchase Details
Closed on
Jun 21, 2010
Sold by
Property Mill Llc
Bought by
Yelli Brandon L
Current Estimated Value
Home Financials for this Owner
Home Financials are based on the most recent Mortgage that was taken out on this home.
Original Mortgage
$108,538
Outstanding Balance
$72,998
Interest Rate
5.12%
Mortgage Type
FHA
Estimated Equity
$127,373
Purchase Details
Closed on
Aug 18, 2009
Sold by
Mangus Becki and Pappas Brenda
Bought by
Property Mill Llc
Home Financials for this Owner
Home Financials are based on the most recent Mortgage that was taken out on this home.
Original Mortgage
$47,923
Interest Rate
5.17%
Mortgage Type
Purchase Money Mortgage
Purchase Details
Closed on
Aug 14, 2009
Sold by
Mangus Becki and Pappas Brenda
Bought by
Property Mill Llc
Home Financials for this Owner
Home Financials are based on the most recent Mortgage that was taken out on this home.
Original Mortgage
$47,923
Interest Rate
5.17%
Mortgage Type
Purchase Money Mortgage
Create a Home Valuation Report for This Property
The Home Valuation Report is an in-depth analysis detailing your home's value as well as a comparison with similar homes in the area
Home Values in the Area
Average Home Value in this Area
Purchase History
| Date | Buyer | Sale Price | Title Company |
|---|---|---|---|
| Yelli Brandon L | -- | Professional Title Services | |
| Property Mill Llc | -- | None Available | |
| Property Mill Llc | -- | Professional Title Services |
Source: Public Records
Mortgage History
| Date | Status | Borrower | Loan Amount |
|---|---|---|---|
| Open | Yelli Brandon L | $108,538 | |
| Previous Owner | Property Mill Llc | $47,923 |
Source: Public Records
Tax History Compared to Growth
Tax History
| Year | Tax Paid | Tax Assessment Tax Assessment Total Assessment is a certain percentage of the fair market value that is determined by local assessors to be the total taxable value of land and additions on the property. | Land | Improvement |
|---|---|---|---|---|
| 2025 | $744 | $61,268 | $24,782 | $36,486 |
| 2024 | $954 | $79,434 | $17,160 | $62,274 |
| 2023 | $998 | $88,651 | $11,972 | $76,679 |
| 2022 | $1,037 | $82,632 | $9,954 | $72,678 |
| 2021 | $898 | $110,963 | $15,208 | $95,755 |
| 2020 | $882 | $54,749 | $0 | $0 |
| 2019 | $788 | $51,272 | $0 | $0 |
| 2018 | $677 | $44,927 | $0 | $0 |
| 2017 | $669 | $44,927 | $0 | $0 |
| 2016 | $603 | $44,927 | $0 | $0 |
| 2015 | $603 | $44,927 | $0 | $0 |
| 2014 | $599 | $44,927 | $0 | $0 |
| 2013 | $711 | $52,834 | $0 | $0 |
Source: Public Records
Map
Nearby Homes