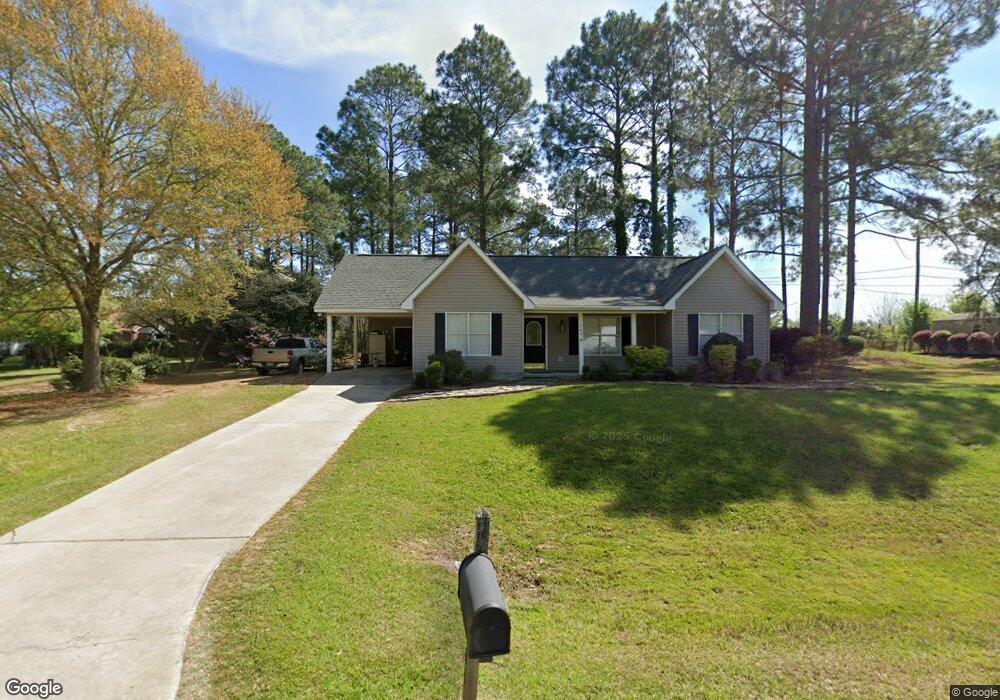
164 Wenona Way Fitzgerald, GA 31750
Estimated Value: $148,000 - $197,000
3
Beds
2
Baths
1,242
Sq Ft
$136/Sq Ft
Est. Value
About This Home
This home is located at 164 Wenona Way, Fitzgerald, GA 31750 and is currently estimated at $169,147, approximately $136 per square foot. 164 Wenona Way is a home located in Ben Hill County with nearby schools including Ben Hill County Primary School, Ben Hill Elementary School, and Ben Hill County Middle School.
Ownership History
Date
Name
Owned For
Owner Type
Purchase Details
Closed on
Jun 2, 2023
Sold by
Campbell Ross Harrison
Bought by
Young Brandon Kenneth
Current Estimated Value
Home Financials for this Owner
Home Financials are based on the most recent Mortgage that was taken out on this home.
Original Mortgage
$140,510
Outstanding Balance
$82,780
Interest Rate
6.39%
Mortgage Type
New Conventional
Estimated Equity
$86,367
Purchase Details
Closed on
Aug 21, 2007
Sold by
Wilson Mary B
Bought by
Campbell Ross Harrison and Davis Pamela Kristin
Home Financials for this Owner
Home Financials are based on the most recent Mortgage that was taken out on this home.
Original Mortgage
$89,300
Interest Rate
6.65%
Mortgage Type
New Conventional
Purchase Details
Closed on
Jul 25, 2000
Sold by
Rycroft John E
Bought by
Wilson Mary B
Purchase Details
Closed on
Mar 9, 2000
Sold by
Crossview Baptist Ch
Bought by
Rycroft John E
Create a Home Valuation Report for This Property
The Home Valuation Report is an in-depth analysis detailing your home's value as well as a comparison with similar homes in the area
Home Values in the Area
Average Home Value in this Area
Purchase History
| Date | Buyer | Sale Price | Title Company |
|---|---|---|---|
| Young Brandon Kenneth | $158,000 | -- | |
| Campbell Ross Harrison | $94,000 | -- | |
| Wilson Mary B | $60,000 | -- | |
| Rycroft John E | $5,500 | -- |
Source: Public Records
Mortgage History
| Date | Status | Borrower | Loan Amount |
|---|---|---|---|
| Open | Young Brandon Kenneth | $140,510 | |
| Previous Owner | Campbell Ross Harrison | $89,300 |
Source: Public Records
Tax History Compared to Growth
Tax History
| Year | Tax Paid | Tax Assessment Tax Assessment Total Assessment is a certain percentage of the fair market value that is determined by local assessors to be the total taxable value of land and additions on the property. | Land | Improvement |
|---|---|---|---|---|
| 2024 | $1,359 | $50,333 | $6,400 | $43,933 |
| 2023 | $668 | $45,775 | $6,400 | $39,375 |
| 2022 | $1,131 | $40,185 | $6,400 | $33,785 |
| 2021 | $948 | $33,577 | $5,400 | $28,177 |
| 2020 | $945 | $33,192 | $5,400 | $27,792 |
| 2019 | $941 | $33,192 | $5,400 | $27,792 |
| 2018 | $1,093 | $33,038 | $5,400 | $27,638 |
| 2017 | $930 | $32,728 | $5,400 | $27,328 |
| 2016 | $882 | $32,527 | $5,400 | $27,127 |
| 2015 | -- | $32,796 | $5,400 | $27,396 |
| 2014 | -- | $33,335 | $5,400 | $27,935 |
Source: Public Records
Map
Nearby Homes
- 141 Wenona Way
- 114 Creole Ct
- 178 Burnside Rd
- 112 Manor Dr
- 0 Benjamin H Hill Dr Unit 21545626
- 225 Meadowlark Ln
- 146 Franklin Ave
- 117 Meadowlark Ln
- 243 Perry House Rd
- 152 David Dr
- 0 Lincoln Ave
- 107 Manassas Place
- 249 Lincoln Ave
- 105 Halsey St
- 271 Lincoln Ave
- 277 Lincoln Ave
- 112 Perry House Rd
- 1171 W Roanoke Dr Ext None
- 138 Azalea Ln
- 221 Gettysburg Rd
- 145 Wenona Way
- 160 Wenona Way
- 168 Wenona Way
- 171 Wenona Way
- 163 Wenona Way
- 123 Edinburg Dr
- 172 Wenona Way
- 110 Stratford St W
- 117 Edinburg Dr
- 117 Edinburg Dr Unit 17
- 204 Jeff Davis Hwy
- 122 Edinburg Dr
- 116 Edinburg Dr
- 205 El Harris Rd
- 225 El Harris Rd
- 192 Jeff Davis Hwy
- 197 El Harris Rd
- 141 SE Wenona
- 226 Jeff Davis Hwy
- 112 Edinburg Dr