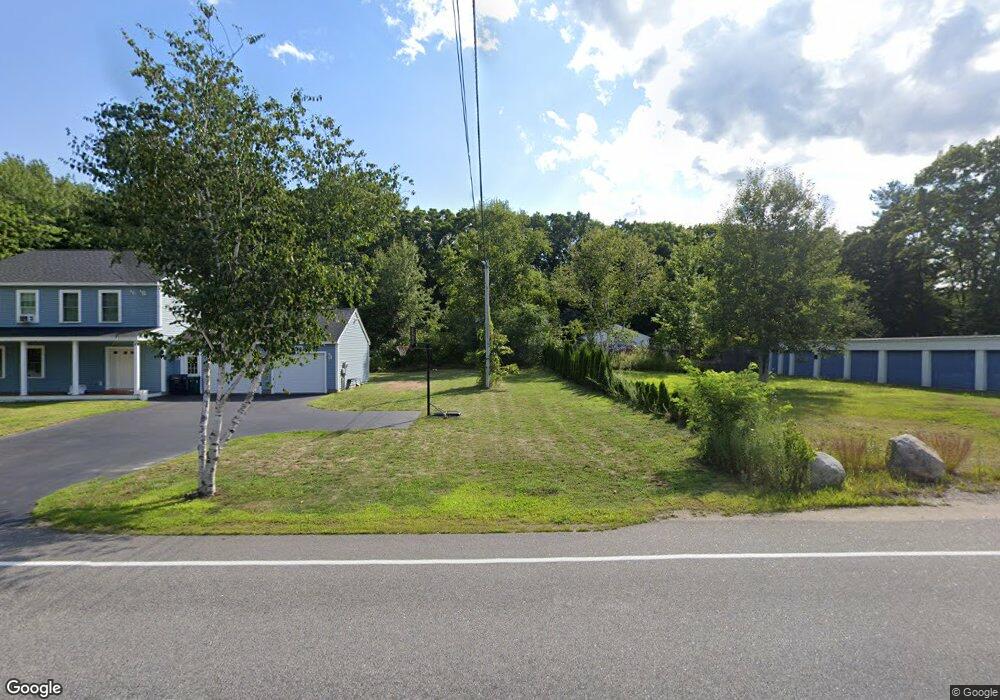
164 West St Biddeford, ME 04005
South Biddeford NeighborhoodEstimated Value: $382,000 - $468,000
3
Beds
2
Baths
1,366
Sq Ft
$323/Sq Ft
Est. Value
About This Home
This home is located at 164 West St, Biddeford, ME 04005 and is currently estimated at $441,824, approximately $323 per square foot. 164 West St is a home located in York County with nearby schools including John F Kennedy Memorial School, Biddeford Primary School, and Biddeford Intermediate School.
Ownership History
Date
Name
Owned For
Owner Type
Purchase Details
Closed on
Feb 15, 2005
Sold by
Boudreau Bonnie J and Boudreau Thomas A
Bought by
Harrison Joel
Current Estimated Value
Home Financials for this Owner
Home Financials are based on the most recent Mortgage that was taken out on this home.
Original Mortgage
$92,000
Outstanding Balance
$47,008
Interest Rate
5.83%
Mortgage Type
Purchase Money Mortgage
Estimated Equity
$394,816
Create a Home Valuation Report for This Property
The Home Valuation Report is an in-depth analysis detailing your home's value as well as a comparison with similar homes in the area
Home Values in the Area
Average Home Value in this Area
Purchase History
| Date | Buyer | Sale Price | Title Company |
|---|---|---|---|
| Harrison Joel | -- | -- |
Source: Public Records
Mortgage History
| Date | Status | Borrower | Loan Amount |
|---|---|---|---|
| Open | Harrison Joel | $92,000 |
Source: Public Records
Tax History Compared to Growth
Tax History
| Year | Tax Paid | Tax Assessment Tax Assessment Total Assessment is a certain percentage of the fair market value that is determined by local assessors to be the total taxable value of land and additions on the property. | Land | Improvement |
|---|---|---|---|---|
| 2024 | $4,081 | $287,000 | $177,300 | $109,700 |
| 2023 | $3,727 | $284,100 | $174,400 | $109,700 |
| 2022 | $3,504 | $213,500 | $98,300 | $115,200 |
| 2021 | $2,908 | $184,500 | $83,200 | $101,300 |
| 2020 | $2,943 | $171,300 | $75,700 | $95,600 |
| 2019 | $3,423 | $171,300 | $75,700 | $95,600 |
| 2018 | $3,462 | $171,300 | $75,700 | $95,600 |
| 2017 | $795 | $165,600 | $75,700 | $89,900 |
| 2016 | $3,289 | $165,600 | $75,700 | $89,900 |
| 2015 | $3,030 | $165,600 | $75,700 | $89,900 |
| 2014 | $2,955 | $165,600 | $75,700 | $89,900 |
| 2013 | -- | $189,500 | $66,600 | $122,900 |
Source: Public Records
Map
Nearby Homes