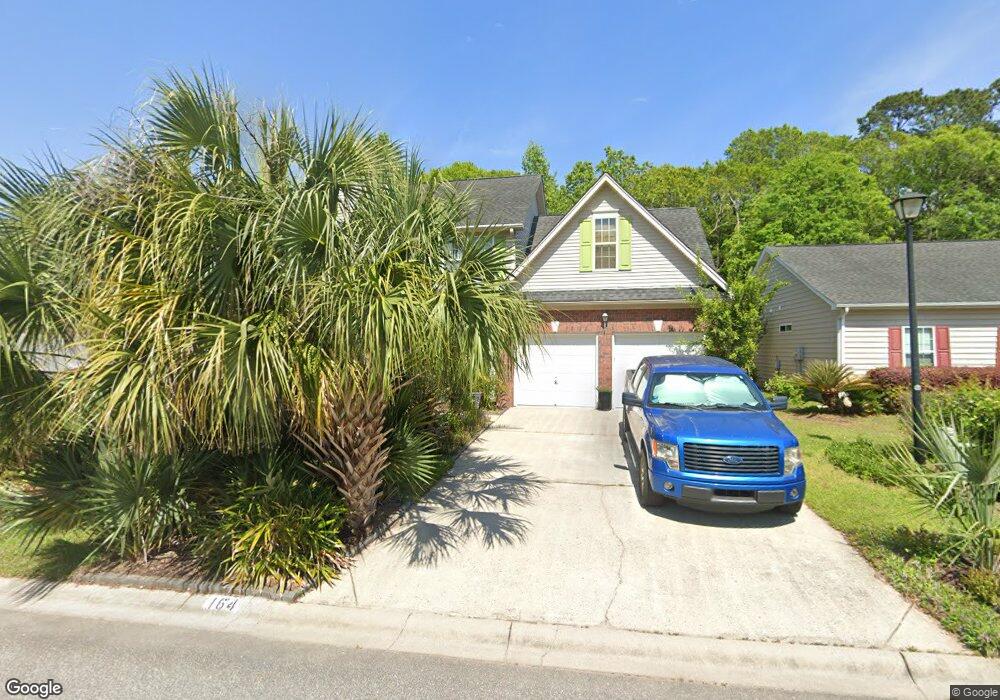
164 Willowbend Ln Summerville, SC 29485
Estimated Value: $382,697 - $450,000
4
Beds
3
Baths
2,447
Sq Ft
$171/Sq Ft
Est. Value
About This Home
This home is located at 164 Willowbend Ln, Summerville, SC 29485 and is currently estimated at $418,674, approximately $171 per square foot. 164 Willowbend Ln is a home located in Dorchester County with nearby schools including Flowertown Elementary School, Gregg Middle School, and Ashley Ridge High School.
Ownership History
Date
Name
Owned For
Owner Type
Purchase Details
Closed on
Jul 15, 2008
Sold by
Prudential Relocation Inc
Bought by
Iden Bradley P and Iden Keri L
Current Estimated Value
Home Financials for this Owner
Home Financials are based on the most recent Mortgage that was taken out on this home.
Original Mortgage
$215,100
Outstanding Balance
$140,863
Interest Rate
6.37%
Mortgage Type
Purchase Money Mortgage
Estimated Equity
$277,811
Purchase Details
Closed on
Jun 16, 2008
Sold by
Brown Stacy A and Brown Terry M
Bought by
Prudential Relocation Inc
Home Financials for this Owner
Home Financials are based on the most recent Mortgage that was taken out on this home.
Original Mortgage
$215,100
Outstanding Balance
$140,863
Interest Rate
6.37%
Mortgage Type
Purchase Money Mortgage
Estimated Equity
$277,811
Purchase Details
Closed on
Apr 15, 2004
Sold by
Summerville Homes Llc
Bought by
Brown Stacy A and Brown Terry M
Purchase Details
Closed on
Nov 14, 2003
Sold by
Dicari Inc
Bought by
Summerville Homes Llc
Create a Home Valuation Report for This Property
The Home Valuation Report is an in-depth analysis detailing your home's value as well as a comparison with similar homes in the area
Home Values in the Area
Average Home Value in this Area
Purchase History
| Date | Buyer | Sale Price | Title Company |
|---|---|---|---|
| Iden Bradley P | $239,000 | -- | |
| Prudential Relocation Inc | $239,000 | -- | |
| Brown Stacy A | $202,000 | -- | |
| Summerville Homes Llc | $252,000 | -- |
Source: Public Records
Mortgage History
| Date | Status | Borrower | Loan Amount |
|---|---|---|---|
| Open | Iden Bradley P | $215,100 | |
| Closed | Prudential Relocation Inc | $215,100 |
Source: Public Records
Tax History Compared to Growth
Tax History
| Year | Tax Paid | Tax Assessment Tax Assessment Total Assessment is a certain percentage of the fair market value that is determined by local assessors to be the total taxable value of land and additions on the property. | Land | Improvement |
|---|---|---|---|---|
| 2024 | $2,583 | $14,271 | $4,000 | $10,271 |
| 2023 | $2,583 | $9,376 | $2,000 | $7,376 |
| 2022 | $2,140 | $9,200 | $2,070 | $7,130 |
| 2021 | $2,226 | $9,200 | $2,070 | $7,130 |
| 2020 | $2,079 | $8,000 | $1,800 | $6,200 |
| 2019 | $2,028 | $8,000 | $1,800 | $6,200 |
| 2018 | $1,803 | $8,000 | $1,800 | $6,200 |
| 2017 | $1,767 | $8,000 | $1,800 | $6,200 |
| 2016 | $1,748 | $8,000 | $1,800 | $6,200 |
| 2015 | $1,750 | $8,000 | $1,800 | $6,200 |
| 2014 | $1,985 | $235,100 | $0 | $0 |
| 2013 | -- | $9,400 | $0 | $0 |
Source: Public Records
Map
Nearby Homes
- 110 Timber Ln
- 107 Walden Ridge Way
- 100 Timber Ln Unit A-D
- 325 Dupont Way
- 109 Thomaston Ave
- 188 Midland Pkwy Unit 507
- 123 Huckleberry Ln
- 565 Travelers Blvd
- 124 Brandywine Dr
- 359 Parish Parc Dr
- 303 High Grove Rd
- 107 Orchard Blossom Ln
- 301 Upshur Ct
- 813 Beverly Dr
- 138 Oakbluff Rd
- 133 Delaney Cir
- 324 Parish Parc Dr
- 109 Squire Ct
- 124 Oakbluff Rd
- 1721 Locals St
- 166 Willowbend Ln
- 162 Willowbend Ln
- 160 Willowbend Ln
- 168 Willowbend Ln
- 165 Willowbend Ln
- 172 Willowbend Ln
- 158 Willowbend Ln
- 163 Willowbend Ln
- 167 Willowbend Ln
- 174 Willowbend Ln
- 169 Willowbend Ln
- 176 Willowbend Ln
- 171 Willowbend Ln
- 147 Willowbend Ln
- 173 Willowbend Ln
- 178 Willowbend Ln
- 156 Willowbend Ln
- 175 Willowbend Ln
- 178 Willow Bend Ln
- 145 Willowbend Ln