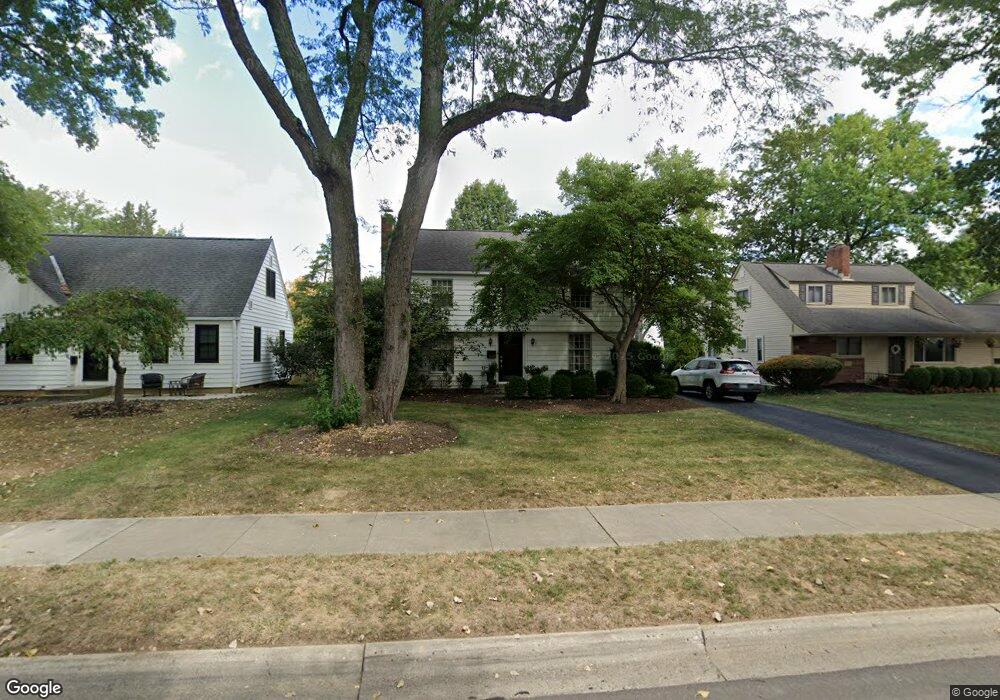
1640 Barrington Rd Columbus, OH 43221
Estimated Value: $589,351 - $676,000
3
Beds
2
Baths
1,886
Sq Ft
$339/Sq Ft
Est. Value
About This Home
This home is located at 1640 Barrington Rd, Columbus, OH 43221 and is currently estimated at $638,588, approximately $338 per square foot. 1640 Barrington Rd is a home located in Franklin County with nearby schools including Barrington Road Elementary School, Jones Middle School, and Upper Arlington High School.
Ownership History
Date
Name
Owned For
Owner Type
Purchase Details
Closed on
May 28, 2004
Sold by
Hoeller William I and Hoeller Jennifer C
Bought by
Hickman Todd D and Mccoy Melissa J
Current Estimated Value
Home Financials for this Owner
Home Financials are based on the most recent Mortgage that was taken out on this home.
Original Mortgage
$279,300
Outstanding Balance
$133,079
Interest Rate
6.06%
Mortgage Type
Purchase Money Mortgage
Estimated Equity
$505,509
Purchase Details
Closed on
Sep 29, 2000
Sold by
Myers Robert W and Myers Linda L
Bought by
Hoeller William I and Hoeller Jennifer C
Home Financials for this Owner
Home Financials are based on the most recent Mortgage that was taken out on this home.
Original Mortgage
$93,000
Interest Rate
7.98%
Purchase Details
Closed on
Sep 4, 1991
Bought by
Myers Robert W and Myers Linda L
Purchase Details
Closed on
May 18, 1988
Purchase Details
Closed on
Jun 1, 1979
Create a Home Valuation Report for This Property
The Home Valuation Report is an in-depth analysis detailing your home's value as well as a comparison with similar homes in the area
Home Values in the Area
Average Home Value in this Area
Purchase History
| Date | Buyer | Sale Price | Title Company |
|---|---|---|---|
| Hickman Todd D | $294,000 | -- | |
| Hoeller William I | $218,000 | Chicago Title | |
| Myers Robert W | $143,900 | -- | |
| -- | -- | -- | |
| -- | $75,000 | -- |
Source: Public Records
Mortgage History
| Date | Status | Borrower | Loan Amount |
|---|---|---|---|
| Open | Hickman Todd D | $279,300 | |
| Closed | Hoeller William I | $93,000 |
Source: Public Records
Tax History
| Year | Tax Paid | Tax Assessment Tax Assessment Total Assessment is a certain percentage of the fair market value that is determined by local assessors to be the total taxable value of land and additions on the property. | Land | Improvement |
|---|---|---|---|---|
| 2025 | $9,943 | $171,750 | $66,890 | $104,860 |
| 2024 | $9,943 | $171,750 | $66,890 | $104,860 |
| 2023 | $9,820 | $171,750 | $66,890 | $104,860 |
| 2022 | $9,517 | $136,190 | $42,420 | $93,770 |
| 2021 | $8,424 | $136,190 | $42,420 | $93,770 |
| 2020 | $8,521 | $136,190 | $42,420 | $93,770 |
| 2019 | $8,060 | $113,750 | $42,420 | $71,330 |
| 2018 | $7,872 | $113,750 | $42,420 | $71,330 |
| 2017 | $7,867 | $113,750 | $42,420 | $71,330 |
| 2016 | $7,735 | $114,390 | $34,270 | $80,120 |
| 2015 | $7,728 | $114,390 | $34,270 | $80,120 |
| 2014 | $7,565 | $114,390 | $34,270 | $80,120 |
| 2013 | $3,698 | $103,985 | $31,150 | $72,835 |
Source: Public Records
Map
Nearby Homes
- 1780 Waltham Rd
- 1627 Doone Rd
- 1951 Glenn Ave
- 1921 Wyandotte Rd
- 1942 Bedford Rd
- 1876 Westwood Ave
- 1565 Berkshire Rd
- 1508 Berkshire Rd
- 1876 Northwest Blvd Unit 2B
- 1810 Ashland Ave
- 1869 Tewksbury Rd
- 1785 Northwest Ct Unit D
- 1775 Northwest Ct Unit 105
- 1838 Berkshire Rd
- 1799 Kings Ct Unit B
- 2208 Arlington Ave
- 1865 Collingswood Rd
- 1507 Chesapeake Ave
- 1493 Chesapeake Ave
- 1783 Northwest Blvd
- 1648 Barrington Rd
- 1632 Barrington Rd
- 1656 Barrington Rd
- 1633 Grenoble Rd
- 1624 Barrington Rd
- 1641 Grenoble Rd
- 1625 Grenoble Rd
- 1649 Grenoble Rd
- 1643 Barrington Rd
- 1664 Barrington Rd
- 1635 Barrington Rd
- 1651 Barrington Rd
- 1619 Grenoble Rd
- 1616 Barrington Rd
- 1657 Grenoble Rd
- 1625 Barrington Rd
- 1659 Barrington Rd
- 1672 Barrington Rd
- 1617 Barrington Rd
- 1667 Barrington Rd
Your Personal Tour Guide
Ask me questions while you tour the home.