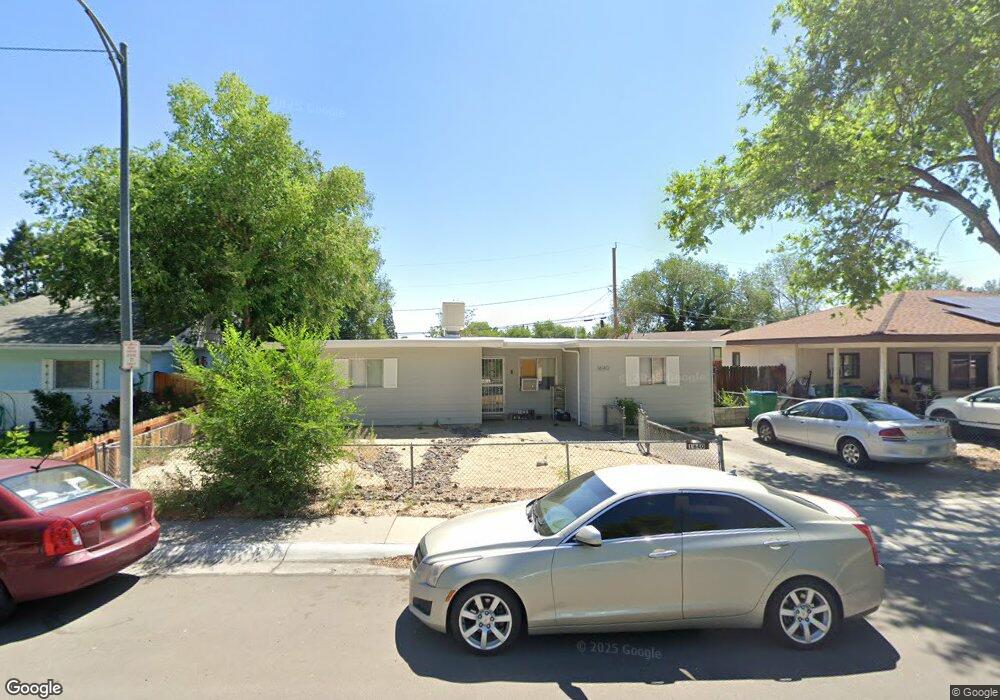
1640 Beech St Reno, NV 89512
West University NeighborhoodEstimated Value: $344,000 - $432,000
3
Beds
2
Baths
1,136
Sq Ft
$334/Sq Ft
Est. Value
About This Home
This home is located at 1640 Beech St, Reno, NV 89512 and is currently estimated at $379,165, approximately $333 per square foot. 1640 Beech St is a home located in Washoe County with nearby schools including Dorothy Lemelson STEM Academy Elementary School, Fred W. Traner Middle School, and Procter R. Hug High School.
Ownership History
Date
Name
Owned For
Owner Type
Purchase Details
Closed on
Oct 25, 2024
Sold by
Warren Jason and Ravencroft Christopher
Bought by
Greater Northern Investments Llc
Current Estimated Value
Purchase Details
Closed on
Jul 18, 2024
Sold by
Alberico-Ravencroft Melissa
Bought by
Ravencroft Christopher
Home Financials for this Owner
Home Financials are based on the most recent Mortgage that was taken out on this home.
Original Mortgage
$300,000
Interest Rate
6.99%
Mortgage Type
New Conventional
Purchase Details
Closed on
Jul 27, 2023
Sold by
Trust Under Will Of Cecile M Morelli
Bought by
Warren Jason and Ravecroft Chris
Purchase Details
Closed on
Jul 13, 2000
Sold by
Morelli Lawrence T
Bought by
Morelli Cecile and Morelli Lawrence T
Create a Home Valuation Report for This Property
The Home Valuation Report is an in-depth analysis detailing your home's value as well as a comparison with similar homes in the area
Home Values in the Area
Average Home Value in this Area
Purchase History
| Date | Buyer | Sale Price | Title Company |
|---|---|---|---|
| Greater Northern Investments Llc | -- | None Listed On Document | |
| Ravencroft Christopher | -- | Core Title Group Llc | |
| Warren Jason | -- | Core Title Group Llc | |
| Warren Jason | -- | Core Title Group Llc | |
| Warren Jason | $280,000 | Title Clearing & Escrow | |
| Morelli Cecile | -- | -- |
Source: Public Records
Mortgage History
| Date | Status | Borrower | Loan Amount |
|---|---|---|---|
| Previous Owner | Ravencroft Christopher | $300,000 |
Source: Public Records
Tax History
| Year | Tax Paid | Tax Assessment Tax Assessment Total Assessment is a certain percentage of the fair market value that is determined by local assessors to be the total taxable value of land and additions on the property. | Land | Improvement |
|---|---|---|---|---|
| 2026 | $509 | $46,057 | $30,660 | $15,397 |
| 2025 | $635 | $45,606 | $30,310 | $15,296 |
| 2024 | $635 | $43,583 | $28,455 | $15,128 |
| 2023 | $587 | $44,736 | $30,765 | $13,971 |
| 2022 | $570 | $35,501 | $24,150 | $11,351 |
| 2021 | $553 | $26,982 | $15,960 | $11,022 |
| 2020 | $536 | $25,837 | $14,945 | $10,892 |
| 2019 | $521 | $25,450 | $15,155 | $10,295 |
| 2018 | $507 | $20,113 | $10,255 | $9,858 |
| 2017 | $492 | $18,096 | $8,365 | $9,731 |
| 2016 | $486 | $17,002 | $7,280 | $9,722 |
| 2015 | $488 | $15,295 | $5,635 | $9,660 |
| 2014 | $474 | $13,447 | $4,375 | $9,072 |
| 2013 | -- | $12,444 | $3,605 | $8,839 |
Source: Public Records
Map
Nearby Homes
- 540 Cranleigh Dr
- 285 Bartlett St
- 650 Denslowe Dr
- 670 Denslowe Dr
- 462 Laurel St
- 1449 Hillside Dr
- 711 Evans Ave
- 1035 N Sierra St
- 442 E 7th St Unit 1 & 2
- 440 E 7th St
- 344 E 7th St
- 336 E 7th St
- 1111 Strand Place
- 407 Imperial Blvd
- 424 W 10th St
- 960 Ralston St
- 1939 Wilder St
- 521 Lake St
- 1955 Wilder St
- 920 Montello St
- 1620 Beech St
- 1660 Beech St
- 1665 Jackson Place
- 1680 Beech St Unit B
- 1680 Beech St
- 1645 Jackson Place
- 1600 Beech St
- 1675 Jackson Place
- 1645 Beech St
- 1625 Beech St
- 1685 Jackson Place
- 1675 Beech St
- 1605 Beech St
- 1625 Jackson Place
- 1695 Beech St
- 305 Raffetto Dr
- 315 Raffetto Dr
- 1640 Jackson Place
- 50 Bisby St
- 60 Bisby St
Your Personal Tour Guide
Ask me questions while you tour the home.