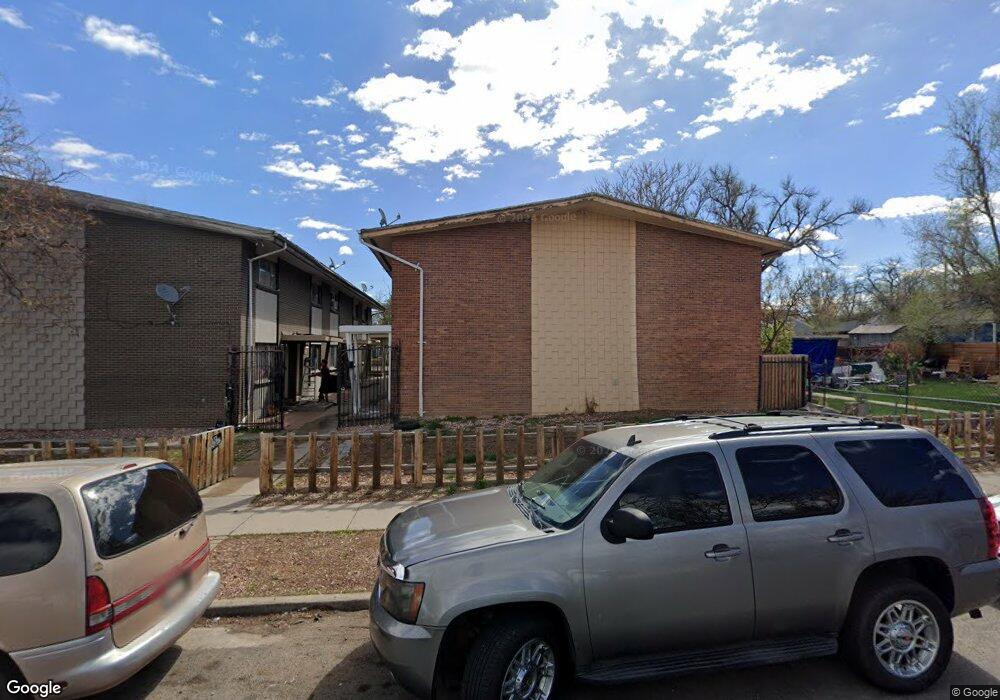
1640 Chester St Unit 1640 Aurora, CO 80010
North Aurora NeighborhoodEstimated Value: $129,000 - $163,001
2
Beds
2
Baths
912
Sq Ft
$158/Sq Ft
Est. Value
About This Home
This home is located at 1640 Chester St Unit 1640, Aurora, CO 80010 and is currently estimated at $144,500, approximately $158 per square foot. 1640 Chester St Unit 1640 is a home located in Adams County with nearby schools including Crawford Elementary School, Myrtle Avenue Elementary School, and Neil Cummins Elementary School.
Ownership History
Date
Name
Owned For
Owner Type
Purchase Details
Closed on
Jan 27, 2009
Sold by
Wells Fargo Bank Na
Bought by
Herrera Julio
Current Estimated Value
Purchase Details
Closed on
Dec 16, 2008
Sold by
English Angelica
Bought by
Wells Fargo Bank Na
Purchase Details
Closed on
Nov 29, 2004
Sold by
Hud
Bought by
English Angelica
Home Financials for this Owner
Home Financials are based on the most recent Mortgage that was taken out on this home.
Original Mortgage
$55,350
Interest Rate
7.85%
Mortgage Type
Unknown
Purchase Details
Closed on
Dec 28, 1999
Sold by
San Miguel Condominium Development Co
Bought by
Rodriguez Guadalupe
Home Financials for this Owner
Home Financials are based on the most recent Mortgage that was taken out on this home.
Original Mortgage
$28,000
Interest Rate
10%
Create a Home Valuation Report for This Property
The Home Valuation Report is an in-depth analysis detailing your home's value as well as a comparison with similar homes in the area
Home Values in the Area
Average Home Value in this Area
Purchase History
| Date | Buyer | Sale Price | Title Company |
|---|---|---|---|
| Herrera Julio | $19,000 | Chicago Title Co | |
| Wells Fargo Bank Na | -- | None Available | |
| English Angelica | $61,500 | Oxford Title | |
| Rodriguez Guadalupe | $76,000 | Land Title |
Source: Public Records
Mortgage History
| Date | Status | Borrower | Loan Amount |
|---|---|---|---|
| Previous Owner | English Angelica | $55,350 | |
| Previous Owner | Rodriguez Guadalupe | $28,000 |
Source: Public Records
Tax History Compared to Growth
Tax History
| Year | Tax Paid | Tax Assessment Tax Assessment Total Assessment is a certain percentage of the fair market value that is determined by local assessors to be the total taxable value of land and additions on the property. | Land | Improvement |
|---|---|---|---|---|
| 2024 | $865 | $8,880 | $2,190 | $6,690 |
| 2023 | $879 | $11,970 | $1,690 | $10,280 |
| 2022 | $1,065 | $9,370 | $1,740 | $7,630 |
| 2021 | $1,109 | $9,370 | $1,740 | $7,630 |
| 2020 | $1,171 | $9,920 | $1,790 | $8,130 |
| 2019 | $1,169 | $9,920 | $1,790 | $8,130 |
| 2018 | $441 | $3,730 | $360 | $3,370 |
| 2017 | $392 | $3,730 | $360 | $3,370 |
| 2016 | $148 | $1,400 | $400 | $1,000 |
| 2015 | $144 | $1,400 | $400 | $1,000 |
| 2014 | $266 | $2,550 | $400 | $2,150 |
Source: Public Records
Map
Nearby Homes
- 1628 Chester St Unit 1628
- 1658 Chester St
- 1548 Chester St
- 1758 Chester St
- 1738 Boston St
- 1558 Dallas St
- 1695 Alton St
- 1930 Chester St
- 1480 Boston St
- 1940 Chester St
- 1395 Dayton St
- 9011 E 14th Ave
- 1558 Xenia St
- 1956 Elmira St
- 1454 Elmira St
- 1537 Xenia St
- 1533 Xenia St
- 1926 Xenia St
- 2000 Elmira St
- 1396 Fulton St
- 1638 Chester St Unit 1638
- 1636 Chester St Unit 1636
- 1636 Chester St Unit Bldg 1
- 1636 Chester St Unit 11636
- 1634 Chester St Unit 1634
- 1632 Chester St Unit 1632
- 1632 Chester St Unit 1
- 1650 Chester St Unit 1650
- 1652 Chester St Unit 1652
- 1646 Chester St Unit 1646
- 1630 Chester St Unit 1630
- 1648 Chester St Unit 1648
- 1648 Chester St
- 1624 Chester St
- 1644 Chester St Unit 1644
- 1644 Chester St
- 1642 Chester St Unit 1642
- 1620 Chester St
- 1643 Clinton St
- 1643 Clinton St