Estimated Value: $219,000 - $241,655
3
Beds
2
Baths
1,118
Sq Ft
$209/Sq Ft
Est. Value
About This Home
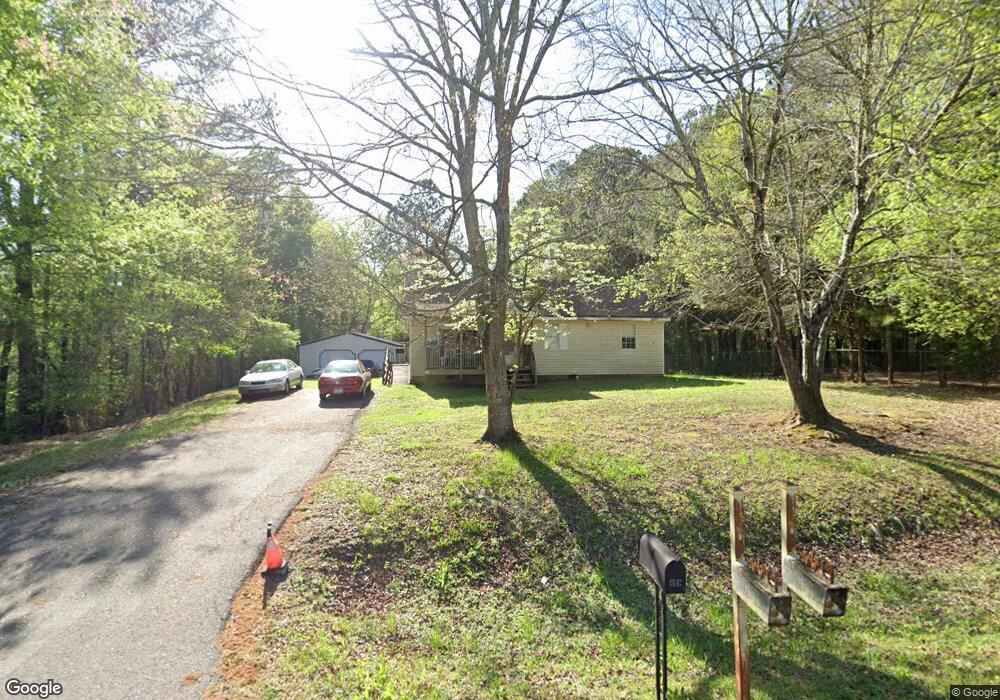
This home is located at 1640 Cleburne Pkwy, Hiram, GA 30141 and is currently estimated at $233,664, approximately $209 per square foot. 1640 Cleburne Pkwy is a home located in Paulding County with nearby schools including Hiram Elementary School, J. A. Dobbins Middle School, and Hiram High School.
Ownership History
Date
Name
Owned For
Owner Type
Purchase Details
Closed on
Apr 1, 2012
Sold by
Cane John
Bought by
Dean Willie E and Dean Corena
Current Estimated Value
Purchase Details
Closed on
Mar 30, 2009
Sold by
Manista Bernard F
Bought by
Cane John
Purchase Details
Closed on
Oct 5, 2006
Sold by
Bank One Na
Bought by
Triad Guaranty Insurance Corp
Home Financials for this Owner
Home Financials are based on the most recent Mortgage that was taken out on this home.
Original Mortgage
$17,900
Interest Rate
6.17%
Mortgage Type
New Conventional
Purchase Details
Closed on
Sep 29, 2006
Sold by
Triad Guaranty Insurance Corp
Bought by
Manista Bernard F
Home Financials for this Owner
Home Financials are based on the most recent Mortgage that was taken out on this home.
Original Mortgage
$17,900
Interest Rate
6.17%
Mortgage Type
New Conventional
Create a Home Valuation Report for This Property
The Home Valuation Report is an in-depth analysis detailing your home's value as well as a comparison with similar homes in the area
Home Values in the Area
Average Home Value in this Area
Purchase History
| Date | Buyer | Sale Price | Title Company |
|---|---|---|---|
| Dean Willie E | -- | -- | |
| Cane John | -- | -- | |
| Triad Guaranty Insurance Corp | -- | -- | |
| Manista Bernard F | $89,800 | -- |
Source: Public Records
Mortgage History
| Date | Status | Borrower | Loan Amount |
|---|---|---|---|
| Previous Owner | Triad Guaranty Insurance Corp | $17,900 | |
| Previous Owner | Manista Bernard F | $71,800 |
Source: Public Records
Tax History Compared to Growth
Tax History
| Year | Tax Paid | Tax Assessment Tax Assessment Total Assessment is a certain percentage of the fair market value that is determined by local assessors to be the total taxable value of land and additions on the property. | Land | Improvement |
|---|---|---|---|---|
| 2024 | $616 | $94,148 | $4,400 | $89,748 |
| 2023 | $679 | $87,628 | $4,280 | $83,348 |
| 2022 | $621 | $78,604 | $3,280 | $75,324 |
| 2021 | $578 | $60,044 | $2,560 | $57,484 |
| 2020 | $545 | $53,808 | $2,440 | $51,368 |
| 2019 | $501 | $48,000 | $2,560 | $45,440 |
| 2018 | $459 | $44,776 | $6,360 | $38,416 |
| 2017 | $426 | $40,540 | $6,080 | $34,460 |
| 2016 | $302 | $30,624 | $6,080 | $24,544 |
| 2015 | $261 | $26,068 | $4,000 | $22,068 |
| 2014 | $407 | $25,060 | $4,000 | $21,060 |
| 2013 | -- | $19,560 | $4,000 | $15,560 |
Source: Public Records
Map
Nearby Homes
- 214 S Lake Dr
- 0 Morris Rd Unit 7337374
- 0 Morris Rd Unit 10626403
- 0 Morris Rd Unit 10352308
- 24 Echo Ridge Dr
- 54 Jean Ct
- 3880 Hiram Lithia Springs Rd SW
- 3920 Hiram Lithia Springs Rd
- 5785 Angham Rd
- 965 Angham Rd
- 5670 Walnut Mill Ln
- 3861 Riding Trail SW
- 4291 Defoors Farm Trail
- 589 Linda Ln
- 5554 Racetrack Ct
- 3419 Redwood Forest Ln
- 3204 Creek Trace W
- 3225 Warren Creek Dr
- 5641 Riding Woods Dr SW
- 480 Pool Rd
- 1601 Cleburne Pkwy
- 85 Barnett Path
- 1633 Cleburne Pkwy
- 1580 Cleburne Pkwy
- 000 Harpers Lake Dr
- 1619 Cleburne Pkwy
- 1673 Cleburne Pkwy
- 1572 Cleburne Pkwy
- 1716 Cleburne Pkwy
- 38 Harpers Lake Dr
- 44 S Lake Dr
- 1707 Cleburne Pkwy
- 1589 Cleburne Pkwy
- 52 Harpers Lake Dr
- 1558 Cleburne Pkwy
- 66 Harpers Lake Dr
- 1573 Cleburne Pkwy
- 1745 Cleburne Pkwy
- 98 Harpers Lake Dr
- 1549 Cleburne Pkwy