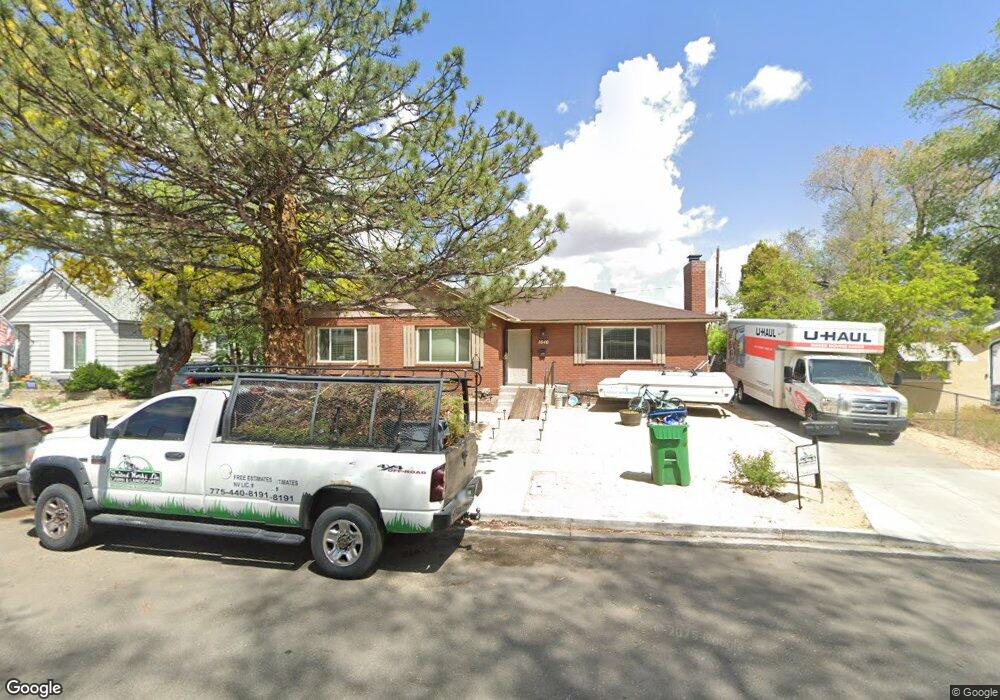
1640 F St Sparks, NV 89431
Downtown Sparks NeighborhoodEstimated Value: $509,547 - $643,000
4
Beds
4
Baths
3,110
Sq Ft
$187/Sq Ft
Est. Value
About This Home
This home is located at 1640 F St, Sparks, NV 89431 and is currently estimated at $580,137, approximately $186 per square foot. 1640 F St is a home located in Washoe County with nearby schools including Robert Mitchell Elementary School, Sparks Middle School, and Sparks High School.
Ownership History
Date
Name
Owned For
Owner Type
Purchase Details
Closed on
Dec 13, 2016
Sold by
Yamamoto Ronald Ichiro and Yamamoto Kikue Jane
Bought by
Kempler Invesments Llc
Current Estimated Value
Purchase Details
Closed on
Feb 28, 2005
Sold by
The Roman Catholic Archbishop Of San Fra
Bought by
Yamamoto Ronald Ichiro and Yamamoto Kikue Jane
Purchase Details
Closed on
Nov 4, 2004
Sold by
Custodio Ben V
Bought by
Roman Catholic Archbishop San Francisco
Purchase Details
Closed on
May 26, 1999
Sold by
Custodio Ben V and Custodio Letty M
Bought by
Custodio Ben V and Custodio Leticia M
Create a Home Valuation Report for This Property
The Home Valuation Report is an in-depth analysis detailing your home's value as well as a comparison with similar homes in the area
Home Values in the Area
Average Home Value in this Area
Purchase History
| Date | Buyer | Sale Price | Title Company |
|---|---|---|---|
| Kempler Invesments Llc | $315,000 | Ticor Title Reno | |
| Yamamoto Ronald Ichiro | $353,000 | Stewart Title Of Northern Nv | |
| Roman Catholic Archbishop San Francisco | $121,000 | -- | |
| Custodio Ben V | -- | -- |
Source: Public Records
Tax History Compared to Growth
Tax History
| Year | Tax Paid | Tax Assessment Tax Assessment Total Assessment is a certain percentage of the fair market value that is determined by local assessors to be the total taxable value of land and additions on the property. | Land | Improvement |
|---|---|---|---|---|
| 2025 | $1,889 | $89,497 | $41,720 | $47,777 |
| 2024 | $1,889 | $85,600 | $38,710 | $46,890 |
| 2023 | $1,836 | $82,773 | $39,305 | $43,468 |
| 2022 | $1,781 | $68,324 | $32,865 | $35,459 |
| 2021 | $1,657 | $59,917 | $25,375 | $34,542 |
| 2020 | $1,558 | $60,142 | $26,250 | $33,892 |
| 2019 | $1,482 | $54,544 | $22,470 | $32,074 |
| 2018 | $1,421 | $45,946 | $15,190 | $30,756 |
| 2017 | $1,364 | $44,217 | $14,000 | $30,217 |
| 2016 | $1,333 | $41,426 | $11,200 | $30,226 |
| 2015 | $1,328 | $37,678 | $8,050 | $29,628 |
| 2014 | $1,292 | $35,019 | $7,000 | $28,019 |
| 2013 | -- | $34,028 | $6,160 | $27,868 |
Source: Public Records
Map
Nearby Homes