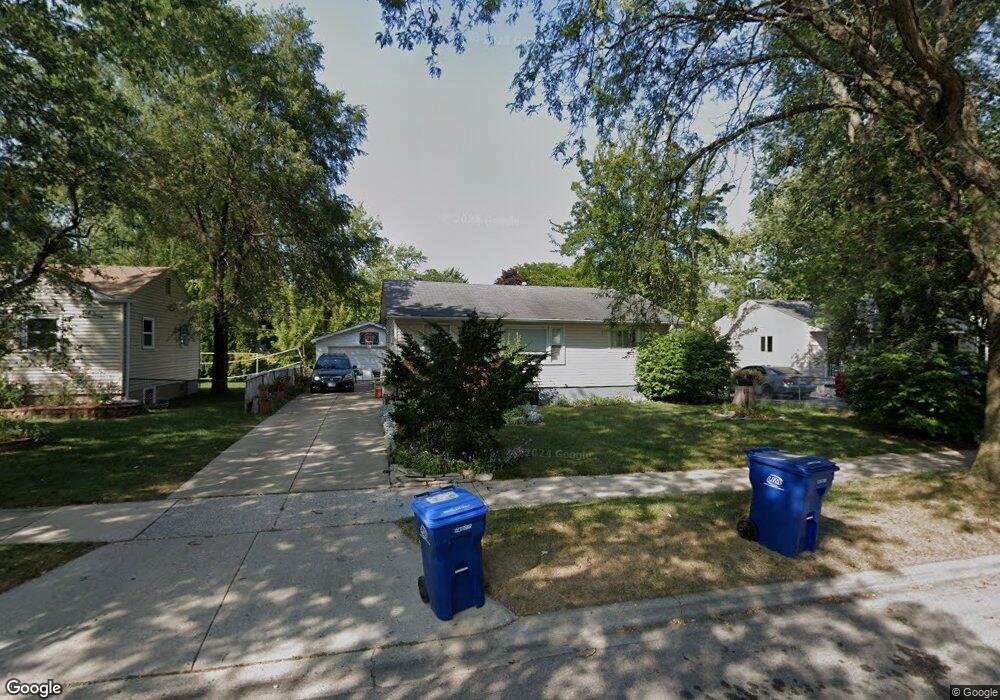
1640 Ferry St Waukegan, IL 60087
Lake County Gardens NeighborhoodEstimated Value: $199,000 - $224,736
3
Beds
2
Baths
864
Sq Ft
$245/Sq Ft
Est. Value
About This Home
This home is located at 1640 Ferry St, Waukegan, IL 60087 and is currently estimated at $211,684, approximately $245 per square foot. 1640 Ferry St is a home located in Lake County with nearby schools including Little Fort Elementary School, Jack Benny Middle School, and Waukegan High School.
Ownership History
Date
Name
Owned For
Owner Type
Purchase Details
Closed on
Jan 8, 2024
Sold by
Rim Properties Llc
Bought by
Rim Properties Llc Series 1640 Ferry
Current Estimated Value
Purchase Details
Closed on
Mar 2, 2011
Sold by
Fonseca Martha
Bought by
Rim Properties Llc
Purchase Details
Closed on
Mar 23, 2009
Sold by
Saxon Mortgage Services Inc
Bought by
Fonseca Martha
Purchase Details
Closed on
Aug 20, 2008
Sold by
Ventura
Bought by
Saxon Mortgage Services Inc
Purchase Details
Closed on
May 23, 2006
Sold by
Ruiz Victor
Bought by
Ventura Alejandra
Home Financials for this Owner
Home Financials are based on the most recent Mortgage that was taken out on this home.
Original Mortgage
$125,600
Interest Rate
9.15%
Mortgage Type
Balloon
Purchase Details
Closed on
Apr 27, 2001
Sold by
Cruz Oscar and Cruz Maria E
Bought by
Ruiz Victor
Home Financials for this Owner
Home Financials are based on the most recent Mortgage that was taken out on this home.
Original Mortgage
$64,600
Interest Rate
6.99%
Create a Home Valuation Report for This Property
The Home Valuation Report is an in-depth analysis detailing your home's value as well as a comparison with similar homes in the area
Home Values in the Area
Average Home Value in this Area
Purchase History
| Date | Buyer | Sale Price | Title Company |
|---|---|---|---|
| Rim Properties Llc Series 1640 Ferry | -- | None Listed On Document | |
| Rim Properties Llc | -- | None Available | |
| Fonseca Martha | $60,000 | Ticor | |
| Saxon Mortgage Services Inc | -- | None Available | |
| Ventura Alejandra | $157,000 | Multiple | |
| Ruiz Victor | $68,000 | Collar Counties Title Plant |
Source: Public Records
Mortgage History
| Date | Status | Borrower | Loan Amount |
|---|---|---|---|
| Previous Owner | Ventura Alejandra | $125,600 | |
| Previous Owner | Ruiz Victor | $64,600 |
Source: Public Records
Tax History Compared to Growth
Tax History
| Year | Tax Paid | Tax Assessment Tax Assessment Total Assessment is a certain percentage of the fair market value that is determined by local assessors to be the total taxable value of land and additions on the property. | Land | Improvement |
|---|---|---|---|---|
| 2024 | $5,588 | $65,601 | $7,773 | $57,828 |
| 2023 | $4,574 | $59,264 | $7,022 | $52,242 |
| 2022 | $4,574 | $46,783 | $6,690 | $40,093 |
| 2021 | $4,264 | $40,899 | $5,791 | $35,108 |
| 2020 | $4,319 | $38,102 | $5,395 | $32,707 |
| 2019 | $4,347 | $34,915 | $4,944 | $29,971 |
| 2018 | $3,597 | $27,821 | $6,298 | $21,523 |
| 2017 | $3,501 | $24,614 | $5,572 | $19,042 |
| 2016 | $3,305 | $21,389 | $4,842 | $16,547 |
| 2015 | $3,234 | $19,144 | $4,334 | $14,810 |
| 2014 | $3,559 | $21,036 | $5,234 | $15,802 |
| 2012 | $4,411 | $22,790 | $5,671 | $17,119 |
Source: Public Records
Map
Nearby Homes
- 1612 Whitney St
- 1636 Rice St
- 2613 N Lewis Ave
- 3211 Rugby Ct
- 2350 N Lewis Ave
- 37966 N Cornell Rd
- 37905 N Loyola Ave
- 3411 N Lewis Ave
- 2232 Walnut St
- 38127 N Shore Ave
- 3101 Country Club Ln
- 38362 N Manor Ave
- 301 W Eagle Ct
- 2708 Dana Ave
- 2705 Dana Ave
- 12312 W Audrey Ave
- 0 Traditions Dr
- 2713 Varonen Ave
- 10241 W Bairstow Ave
- 1730 W Beach Rd
- 1636 Ferry St
- 1644 Ferry St
- 1641 Frazier St
- 1637 Frazier St Unit 4
- 1645 Frazier St
- 1632 Ferry St
- 1648 Ferry St
- 1633 Frazier St Unit 4
- 1649 Frazier St
- 1639 Ferry St
- 1631 Ferry St
- 1628 Ferry St
- 1652 Ferry St
- 1643 Ferry St
- 1629 Frazier St
- 1627 Ferry St
- 1653 Frazier St
- 1647 Ferry St
- 1656 Ferry St
- 1624 Ferry St