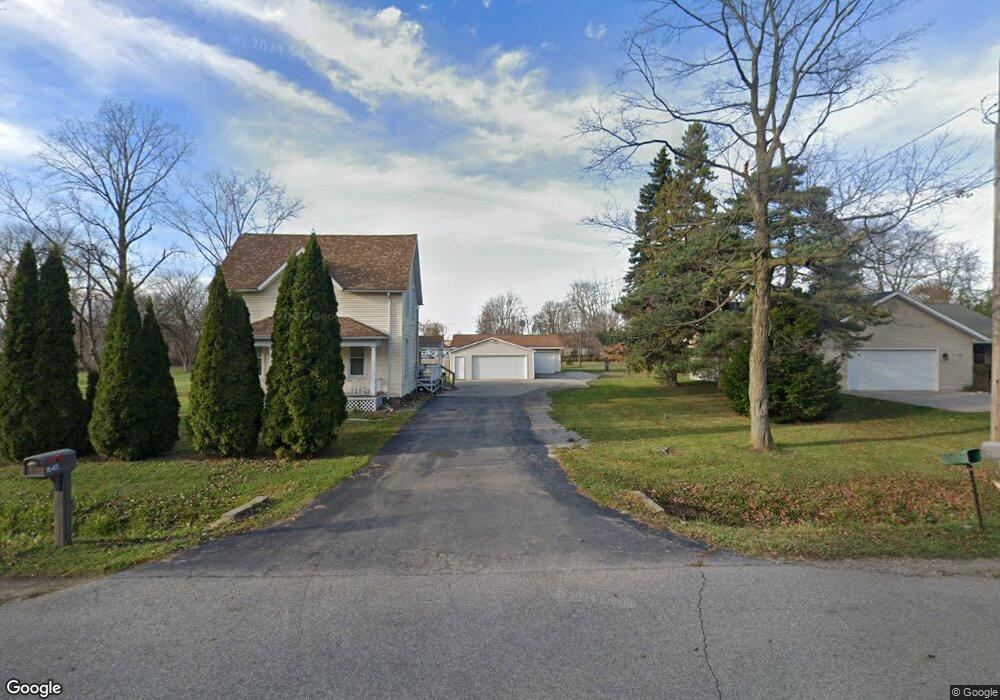
1640 Henry St Port Huron, MI 48060
Estimated Value: $170,000 - $198,523
3
Beds
1
Bath
1,615
Sq Ft
$116/Sq Ft
Est. Value
About This Home
This home is located at 1640 Henry St, Port Huron, MI 48060 and is currently estimated at $187,131, approximately $115 per square foot. 1640 Henry St is a home located in St. Clair County with nearby schools including H.D. Crull Elementary School, Holland Woods Middle School, and Port Huron High School.
Ownership History
Date
Name
Owned For
Owner Type
Purchase Details
Closed on
Oct 25, 2017
Sold by
Hellenbrand Ruth A
Bought by
Easton Properties 3 Llc
Current Estimated Value
Purchase Details
Closed on
Oct 20, 2017
Sold by
Pickelhaupt David
Bought by
Hellenbrand Ruth A
Purchase Details
Closed on
Jul 7, 2017
Sold by
Hellenbrand Ruth A
Bought by
Pickelhaupt David and Hellenbrand Ruth A
Purchase Details
Closed on
Jun 1, 2017
Sold by
Brown Douglas R and Brown Douglas
Bought by
Hellenbrand Ruth A
Create a Home Valuation Report for This Property
The Home Valuation Report is an in-depth analysis detailing your home's value as well as a comparison with similar homes in the area
Home Values in the Area
Average Home Value in this Area
Purchase History
| Date | Buyer | Sale Price | Title Company |
|---|---|---|---|
| Easton Properties 3 Llc | $107,000 | -- | |
| Hellenbrand Ruth A | -- | -- | |
| Pickelhaupt David | -- | None Available | |
| Hellenbrand Ruth A | $107,000 | None Available |
Source: Public Records
Tax History Compared to Growth
Tax History
| Year | Tax Paid | Tax Assessment Tax Assessment Total Assessment is a certain percentage of the fair market value that is determined by local assessors to be the total taxable value of land and additions on the property. | Land | Improvement |
|---|---|---|---|---|
| 2025 | $2,921 | $85,200 | $0 | $0 |
| 2024 | $2,008 | $90,300 | $0 | $0 |
| 2023 | $1,883 | $82,700 | $0 | $0 |
| 2022 | $2,631 | $67,700 | $0 | $0 |
| 2021 | $2,444 | $63,300 | $0 | $0 |
| 2020 | $2,444 | $59,700 | $59,700 | $0 |
| 2019 | $2,398 | $42,800 | $0 | $0 |
| 2018 | $2,342 | $42,800 | $0 | $0 |
| 2017 | $1,013 | $38,500 | $0 | $0 |
| 2016 | $524 | $38,500 | $0 | $0 |
| 2015 | -- | $30,000 | $30,000 | $0 |
| 2014 | -- | $38,000 | $38,000 | $0 |
| 2013 | -- | $41,000 | $0 | $0 |
Source: Public Records
Map
Nearby Homes
- 00 Campau Ave
- 146 Taylor St
- 1825 Kern St
- V/L #4 Water St
- V/L #6 Water St
- V/L #5 Water St
- V/L #8 Water St
- V/L #3 Water St
- 1819 Kern St
- 0000 Campau Ave
- 0000 Water St
- 0000 Manuel St
- 0000 Henry St
- 1819 Riverside Dr
- 1434 Nelson St
- 1907 Riverside Dr
- 1617 Francis St
- 1649 Whipple St
- 1321 Nelson St
- 2636 Locust St