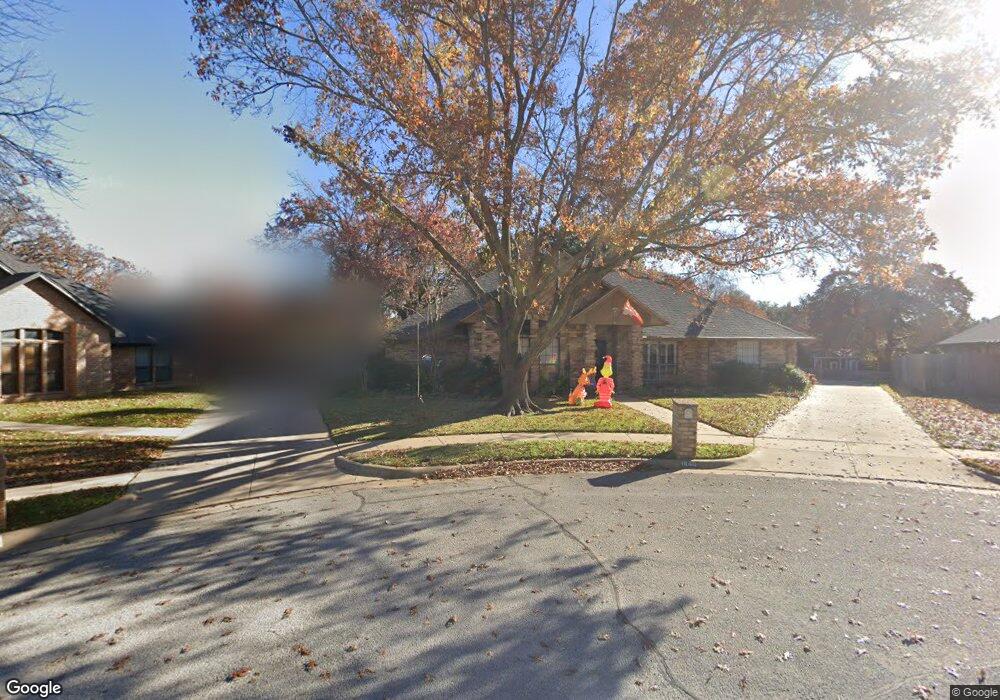
1640 Lancashire Ct Bedford, TX 76021
Estimated Value: $445,735 - $523,000
4
Beds
2
Baths
2,438
Sq Ft
$198/Sq Ft
Est. Value
About This Home
This home is located at 1640 Lancashire Ct, Bedford, TX 76021 and is currently estimated at $483,684, approximately $198 per square foot. 1640 Lancashire Ct is a home located in Tarrant County with nearby schools including Shady Brook Elementary School, Harwood Junior High School, and Trinity High School.
Ownership History
Date
Name
Owned For
Owner Type
Purchase Details
Closed on
Jul 28, 2025
Sold by
Cantrell Ryan and Cantrell Joanna
Bought by
Lancashire Retreat Llc
Current Estimated Value
Purchase Details
Closed on
Jun 20, 2013
Sold by
Wheat Dixi Ann and Talke Dixi Ann
Bought by
Cantrell Ryan and Cantrell Joanna
Home Financials for this Owner
Home Financials are based on the most recent Mortgage that was taken out on this home.
Original Mortgage
$185,250
Interest Rate
3.43%
Mortgage Type
New Conventional
Purchase Details
Closed on
Jun 27, 1997
Sold by
Horine Jon D and Horine Susan K
Bought by
Boyd Wayne and Boyd Theresa
Home Financials for this Owner
Home Financials are based on the most recent Mortgage that was taken out on this home.
Original Mortgage
$140,000
Interest Rate
7.92%
Mortgage Type
Purchase Money Mortgage
Create a Home Valuation Report for This Property
The Home Valuation Report is an in-depth analysis detailing your home's value as well as a comparison with similar homes in the area
Home Values in the Area
Average Home Value in this Area
Purchase History
| Date | Buyer | Sale Price | Title Company |
|---|---|---|---|
| Lancashire Retreat Llc | -- | None Listed On Document | |
| Cantrell Ryan | -- | Reunion Title | |
| Boyd Wayne | -- | Safeco Land Title |
Source: Public Records
Mortgage History
| Date | Status | Borrower | Loan Amount |
|---|---|---|---|
| Previous Owner | Cantrell Ryan | $185,250 | |
| Previous Owner | Boyd Wayne | $140,000 |
Source: Public Records
Tax History Compared to Growth
Tax History
| Year | Tax Paid | Tax Assessment Tax Assessment Total Assessment is a certain percentage of the fair market value that is determined by local assessors to be the total taxable value of land and additions on the property. | Land | Improvement |
|---|---|---|---|---|
| 2025 | $8,203 | $343,755 | $75,000 | $268,755 |
| 2024 | $8,203 | $421,357 | $75,000 | $346,357 |
| 2023 | $7,386 | $385,076 | $75,000 | $310,076 |
| 2022 | $7,978 | $365,255 | $75,000 | $290,255 |
| 2021 | $7,519 | $319,200 | $75,000 | $244,200 |
| 2020 | $7,589 | $319,200 | $75,000 | $244,200 |
| 2019 | $7,292 | $339,994 | $75,000 | $264,994 |
| 2018 | $6,247 | $272,855 | $75,000 | $197,855 |
| 2017 | $6,001 | $264,401 | $30,000 | $234,401 |
| 2016 | $5,455 | $238,281 | $30,000 | $208,281 |
| 2015 | $4,873 | $205,000 | $30,000 | $175,000 |
| 2014 | $4,873 | $237,300 | $30,000 | $207,300 |
Source: Public Records
Map
Nearby Homes
- 22 Lincolnshire Cir
- 37 Devonshire Dr
- 1601 Warwickshire Ct W
- 1630 Post Oak Dr
- 2112 Oakmeadow Place
- 1723 Post Oak Dr
- 2524 Shady Ridge Dr
- 2503 Shady Ridge Dr
- 2109 Oakmeadow St
- 2901 Miles Way
- 2024 Oakmeadow St
- 1704 Indian Oaks Ct
- 1636 Bedford Oaks Dr
- 1401 Danielle Dr
- 31 Morrow Dr
- 49 Morrow Dr
- 2508 Lakeview Dr
- 2220 Tiffany Glenn Ct
- 6 Park Ln
- 18 Park Ln
- 1636 Lancashire Ct
- 2625 Rollingshire Dr
- 1644 Lancashire Ct
- 2621 Rollingshire Dr
- 2629 Rollingshire Dr
- 1632 Bedfordshire
- 1648 Lancashire Ct
- 1717 Berwichshire Ct
- 2617 Rollingshire Dr
- 1713 Berwichshire Ct
- 1628 Bedfordshire
- 1804 Lincolnshire Dr
- 1808 Lincolnshire Dr
- 2613 Rollingshire Dr
- 1800 Lincolnshire Dr
- 2620 Rollingshire Dr
- 1637 Bedfordshire
- 1724 Berwichshire Ct
- 1641 Bedfordshire
- 1812 Lincolnshire Dr