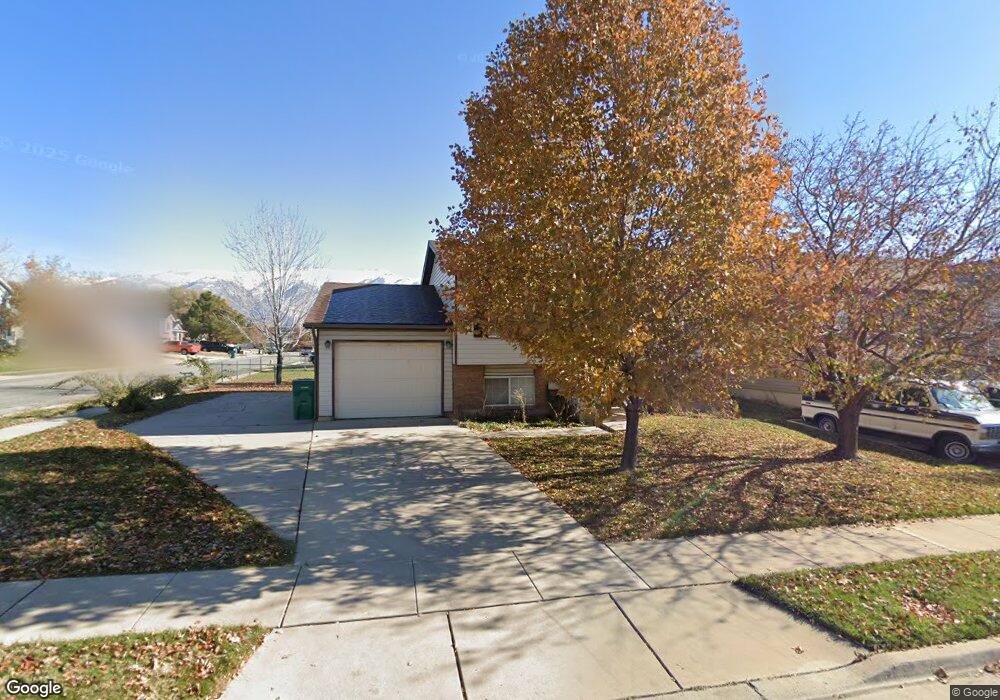
1640 N 275 W Layton, UT 84041
Estimated Value: $409,000 - $451,000
4
Beds
2
Baths
861
Sq Ft
$492/Sq Ft
Est. Value
About This Home
This home is located at 1640 N 275 W, Layton, UT 84041 and is currently estimated at $423,953, approximately $492 per square foot. 1640 N 275 W is a home located in Davis County with nearby schools including Lincoln Elementary School, North Layton Junior High School, and Northridge High School.
Ownership History
Date
Name
Owned For
Owner Type
Purchase Details
Closed on
Apr 17, 2023
Sold by
Jackson Douglas
Bought by
J & J Endeavors 11 Llc
Current Estimated Value
Purchase Details
Closed on
Jun 16, 2022
Sold by
Sharleen Swaner
Bought by
Swaner Sharleen and Jackson Douglas
Purchase Details
Closed on
May 21, 2003
Sold by
Burleson Kathleen and Burleson James E
Bought by
Swaner Sharleen
Home Financials for this Owner
Home Financials are based on the most recent Mortgage that was taken out on this home.
Original Mortgage
$112,500
Interest Rate
5.77%
Mortgage Type
Purchase Money Mortgage
Purchase Details
Closed on
Jun 4, 2001
Sold by
Wood Kathleen and Burleson Kathleen
Bought by
Burleson James E and Burleson Kathleen
Home Financials for this Owner
Home Financials are based on the most recent Mortgage that was taken out on this home.
Original Mortgage
$66,400
Interest Rate
7.14%
Create a Home Valuation Report for This Property
The Home Valuation Report is an in-depth analysis detailing your home's value as well as a comparison with similar homes in the area
Home Values in the Area
Average Home Value in this Area
Purchase History
| Date | Buyer | Sale Price | Title Company |
|---|---|---|---|
| J & J Endeavors 11 Llc | -- | None Listed On Document | |
| Swaner Sharleen | -- | None Listed On Document | |
| Swaner Sharleen | -- | First American Title Co | |
| Burleson James E | -- | Bonneville Title Company Inc |
Source: Public Records
Mortgage History
| Date | Status | Borrower | Loan Amount |
|---|---|---|---|
| Previous Owner | Swaner Sharleen | $112,500 | |
| Previous Owner | Burleson James E | $66,400 |
Source: Public Records
Tax History Compared to Growth
Tax History
| Year | Tax Paid | Tax Assessment Tax Assessment Total Assessment is a certain percentage of the fair market value that is determined by local assessors to be the total taxable value of land and additions on the property. | Land | Improvement |
|---|---|---|---|---|
| 2025 | $1,977 | $209,550 | $87,732 | $121,818 |
| 2024 | $1,909 | $201,850 | $102,751 | $99,099 |
| 2023 | $1,915 | $357,000 | $127,143 | $229,857 |
| 2022 | $1,347 | $196,350 | $65,723 | $130,627 |
| 2021 | $1,347 | $273,000 | $88,347 | $184,653 |
| 2020 | $1,347 | $236,000 | $75,937 | $160,063 |
| 2019 | $1,347 | $229,000 | $73,611 | $155,389 |
| 2018 | $0 | $207,000 | $73,611 | $133,389 |
| 2016 | $1,354 | $99,440 | $22,473 | $76,967 |
| 2015 | $1,297 | $90,420 | $22,473 | $67,947 |
| 2014 | $1,164 | $82,994 | $22,473 | $60,521 |
| 2013 | $1,305 | $88,070 | $22,179 | $65,891 |
Source: Public Records
Map
Nearby Homes