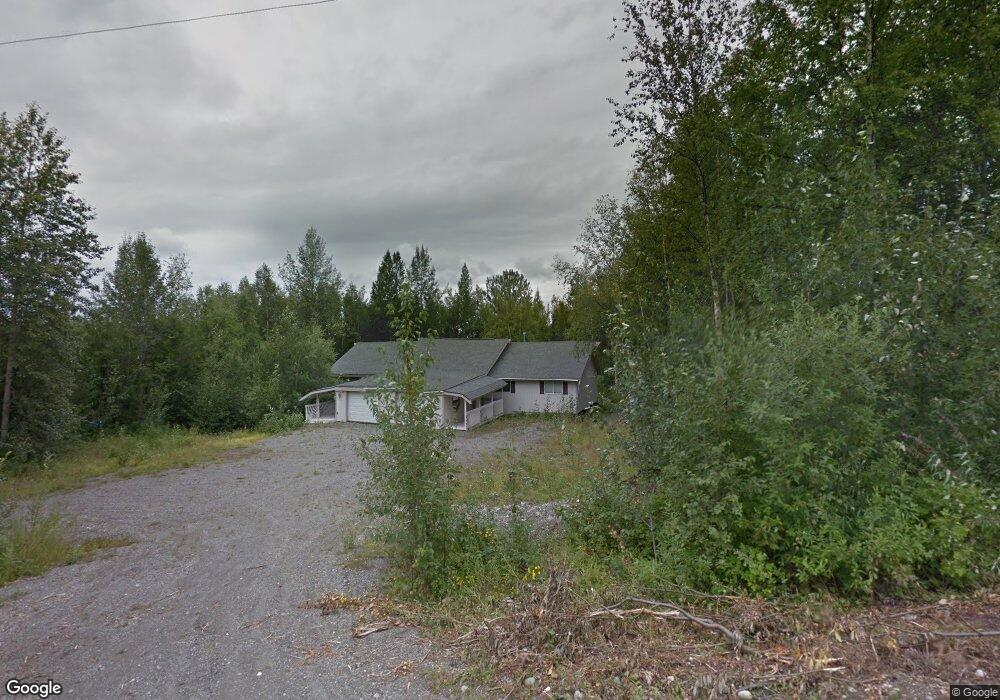
1640 N Centurian Place Wasilla, AK 99654
Estimated Value: $607,000 - $661,603
--
Bed
--
Bath
2,432
Sq Ft
$261/Sq Ft
Est. Value
About This Home
This home is located at 1640 N Centurian Place, Wasilla, AK 99654 and is currently estimated at $634,302, approximately $260 per square foot. 1640 N Centurian Place is a home located in Matanuska-Susitna Borough with nearby schools including Tanaina Elementary School, Wasilla Middle School, and Wasilla High School.
Ownership History
Date
Name
Owned For
Owner Type
Purchase Details
Closed on
May 8, 2008
Sold by
Evertson Krister and Eriksson Kerin
Bought by
Denali Trust
Current Estimated Value
Purchase Details
Closed on
Apr 21, 2008
Sold by
Eriksson Karin D
Bought by
Eriksson Hebdon Lillian Karin
Purchase Details
Closed on
Aug 23, 2004
Sold by
Eriksson Karen
Bought by
Evertson Krister
Purchase Details
Closed on
Jan 16, 2004
Sold by
Ericksson Kris
Bought by
Eriksson Karin
Purchase Details
Closed on
Sep 16, 2002
Sold by
Draeger Alexander A
Bought by
Ericksson Kris
Home Financials for this Owner
Home Financials are based on the most recent Mortgage that was taken out on this home.
Original Mortgage
$9,800
Interest Rate
6.24%
Mortgage Type
Seller Take Back
Create a Home Valuation Report for This Property
The Home Valuation Report is an in-depth analysis detailing your home's value as well as a comparison with similar homes in the area
Home Values in the Area
Average Home Value in this Area
Purchase History
| Date | Buyer | Sale Price | Title Company |
|---|---|---|---|
| Denali Trust | -- | None Available | |
| Eriksson Hebdon Lillian Karin | -- | None Available | |
| Evertson Krister | -- | None Available | |
| Eriksson Karin | -- | -- | |
| Ericksson Kris | -- | -- |
Source: Public Records
Mortgage History
| Date | Status | Borrower | Loan Amount |
|---|---|---|---|
| Previous Owner | Ericksson Kris | $9,800 |
Source: Public Records
Tax History Compared to Growth
Tax History
| Year | Tax Paid | Tax Assessment Tax Assessment Total Assessment is a certain percentage of the fair market value that is determined by local assessors to be the total taxable value of land and additions on the property. | Land | Improvement |
|---|---|---|---|---|
| 2025 | $6,792 | $663,900 | $40,000 | $623,900 |
| 2024 | $6,792 | $641,100 | $40,000 | $601,100 |
| 2023 | $6,271 | $609,100 | $40,000 | $569,100 |
| 2022 | $5,981 | $551,200 | $40,000 | $511,200 |
| 2021 | $5,902 | $488,100 | $40,000 | $448,100 |
| 2020 | $5,612 | $450,000 | $40,000 | $410,000 |
| 2019 | $5,468 | $436,200 | $40,000 | $396,200 |
| 2018 | $5,289 | $423,700 | $40,000 | $383,700 |
| 2017 | $5,051 | $404,700 | $40,000 | $364,700 |
| 2016 | $4,862 | $400,700 | $40,000 | $360,700 |
| 2015 | $4,398 | $389,500 | $32,000 | $357,500 |
| 2014 | $4,398 | $366,700 | $32,000 | $334,700 |
Source: Public Records
Map
Nearby Homes
- 590 W Spruce Ave
- 365 W Crestwood Ave
- 500 W Roy Rd
- 465 W Roy Rd
- 205 W Jensen Cir
- 2165 N Gwene Ln
- 2255 N Pearl Rd
- 844 W Winter Ave
- 412 W Ashbrook Dr
- 2300 N Loren Cir
- 382 W Ashbrook Dr
- 2360 N Beanie St
- 1785 N Lana Cir
- 1148 W Dr
- 1760 W Amethyst Cir
- 1780 N Lana Cir
- 480 E Agate Ln
- 231 E Luther Ave
- 121 E Herning Ave
- 2955 N Tamar Cir
- 1620 N Centurian Place
- 1660 N Centurian Place
- 1675 N Centurian Place
- 1680 N Centurian Place
- 1600 N Centurian Place
- 1551 N Fanciful Place
- 1525 N Fanciful Place Unit 4
- 1525 N Fanciful Place
- 1541 N Fanciful Place
- 1501 N Fanciful Place
- 1501 N Fanciful Place Unit 4
- 1501 N Fanciful Place Unit 1
- 1700 N Centurian Place
- 1575 N Fanciful Place
- 1701 N Centurian Place
- 1751 N Centurian Place
- 1580 N Centurian Place Unit 4
- 1580 N Centurian Place
- 1601 N Centurian Place
- 450 W Heritage Dr