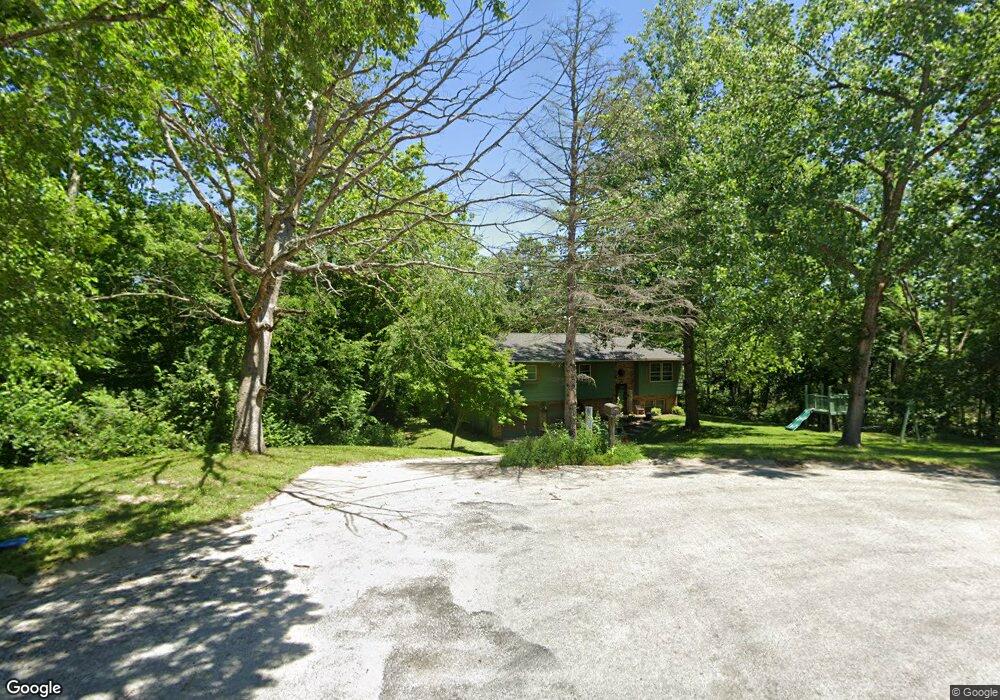
1640 Robin Ct Mount Zion, IL 62549
Estimated Value: $203,000 - $234,000
3
Beds
3
Baths
1,436
Sq Ft
$153/Sq Ft
Est. Value
About This Home
This home is located at 1640 Robin Ct, Mount Zion, IL 62549 and is currently estimated at $219,261, approximately $152 per square foot. 1640 Robin Ct is a home located in Macon County with nearby schools including McGaughey Elementary School, Mt. Zion Elementary School, and Mt. Zion Intermediate School.
Ownership History
Date
Name
Owned For
Owner Type
Purchase Details
Closed on
Oct 14, 2014
Sold by
Pinnow Joshua D and Pinnow Leah Anne
Bought by
Morgason James D and Morgason Amy M
Current Estimated Value
Home Financials for this Owner
Home Financials are based on the most recent Mortgage that was taken out on this home.
Original Mortgage
$113,113
Outstanding Balance
$85,587
Interest Rate
3.75%
Mortgage Type
VA
Estimated Equity
$133,675
Purchase Details
Closed on
Nov 30, 2010
Sold by
Mercer Jerod N and Mercer Nichole D
Bought by
Pinnow Joshua D
Home Financials for this Owner
Home Financials are based on the most recent Mortgage that was taken out on this home.
Original Mortgage
$112,084
Interest Rate
4.22%
Mortgage Type
Purchase Money Mortgage
Purchase Details
Closed on
Mar 1, 2003
Create a Home Valuation Report for This Property
The Home Valuation Report is an in-depth analysis detailing your home's value as well as a comparison with similar homes in the area
Home Values in the Area
Average Home Value in this Area
Purchase History
| Date | Buyer | Sale Price | Title Company |
|---|---|---|---|
| Morgason James D | $110,000 | None Available | |
| Pinnow Joshua D | $1,150,000 | None Available | |
| -- | $98,800 | -- |
Source: Public Records
Mortgage History
| Date | Status | Borrower | Loan Amount |
|---|---|---|---|
| Open | Morgason James D | $113,113 | |
| Previous Owner | Pinnow Joshua D | $112,084 |
Source: Public Records
Tax History
| Year | Tax Paid | Tax Assessment Tax Assessment Total Assessment is a certain percentage of the fair market value that is determined by local assessors to be the total taxable value of land and additions on the property. | Land | Improvement |
|---|---|---|---|---|
| 2024 | $3,859 | $55,443 | $8,470 | $46,973 |
| 2023 | $3,721 | $51,566 | $7,878 | $43,688 |
| 2022 | $3,551 | $48,910 | $7,472 | $41,438 |
| 2021 | $3,435 | $45,820 | $7,000 | $38,820 |
| 2020 | $3,190 | $43,406 | $5,976 | $37,430 |
| 2019 | $3,190 | $43,406 | $5,976 | $37,430 |
| 2018 | $3,087 | $42,297 | $5,823 | $36,474 |
| 2017 | $3,042 | $41,484 | $5,711 | $35,773 |
| 2016 | $3,008 | $40,763 | $5,612 | $35,151 |
| 2015 | $2,907 | $40,359 | $5,556 | $34,803 |
| 2014 | $2,803 | $40,359 | $5,556 | $34,803 |
| 2013 | $2,835 | $40,359 | $5,556 | $34,803 |
Source: Public Records
Map
Nearby Homes
- 1354 Kays Ct
- 9 Blakeridge Place
- 1065 Country Manor
- 645 S Antler Dr
- 625 Fawn Ct
- 1820 Buckhead Ln
- 325 W Wildwood Dr
- 2130 Buckhead Ave
- 2110 Buckhead Ln
- 1935 Buckhead Ct
- 2020 Buckhead Ln
- 2035 Buckhead Blvd
- 2030 Buckhead Ln
- 3930 S Mount Zion Rd
- 3335 S Mount Zion Rd
- 300 South Dr
- Lot 20 Jeffrey Ln
- 210 Bell Ct
- 2833 S Glenwood Dr
- 2620 Lake Reunion Pkwy
- 1620 Robin Ct
- 1100 Nottingham Ct
- 1645 Robin Ct
- 1110 Nottingham Ct
- 1105 Nottingham Ct
- 1120 Del Scott Ct
- 1635 Robin Ct
- 1120 Del-Scott Ct
- 1110 Del Scott Ct
- 1130 Del-Scott Ct
- 1110 Del-Scott Ct
- 1115 Nottingham Ct
- 1130 Del Scott Ct
- 1625 Robin Ct
- 1130 Nottingham Ct
- 1640 Westside Dr
- 1615 Robin Ct
- 1125 Nottingham Ct
- 1100 Del Scott Ct
- 1100 Del-Scott Ct
Your Personal Tour Guide
Ask me questions while you tour the home.