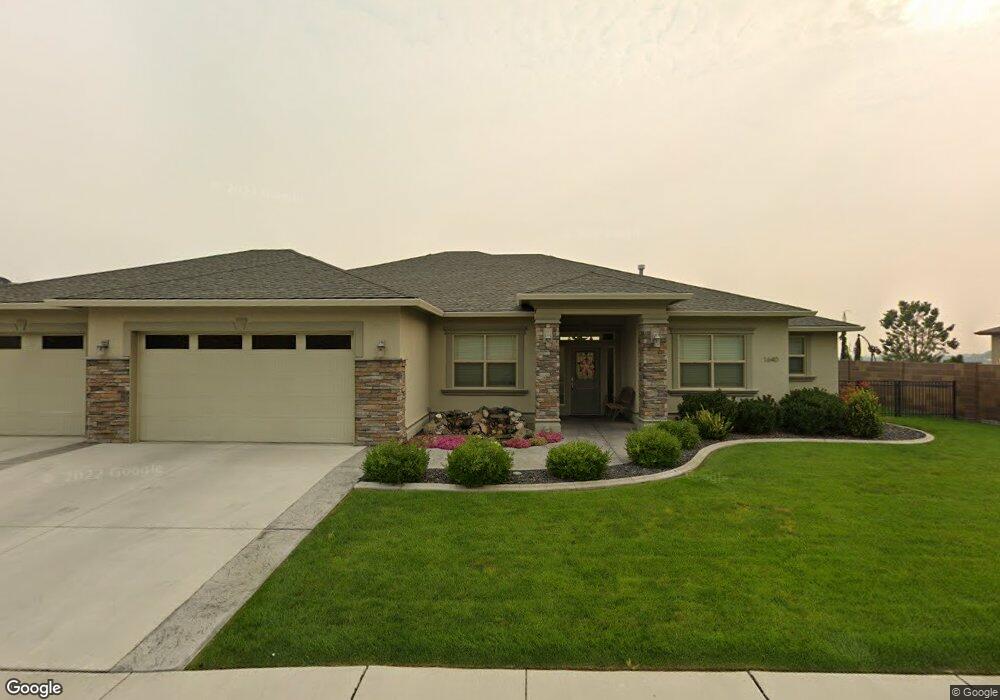
1640 Sorrento Ln Unit The Encore by Prodig Richland, WA 99352
Estimated Value: $783,702 - $870,000
4
Beds
3
Baths
2,670
Sq Ft
$309/Sq Ft
Est. Value
About This Home
This home is located at 1640 Sorrento Ln Unit The Encore by Prodig, Richland, WA 99352 and is currently estimated at $824,926, approximately $308 per square foot. 1640 Sorrento Ln Unit The Encore by Prodig is a home located in Benton County with nearby schools including Orchard Elementary School, Enterprise Middle School, and Richland High School.
Ownership History
Date
Name
Owned For
Owner Type
Purchase Details
Closed on
Mar 19, 2025
Sold by
Kuhta Robert John and Kuhta Brian K
Bought by
Walker Troy and Walker Kathleen
Current Estimated Value
Home Financials for this Owner
Home Financials are based on the most recent Mortgage that was taken out on this home.
Original Mortgage
$774,250
Outstanding Balance
$770,287
Interest Rate
6.87%
Mortgage Type
New Conventional
Estimated Equity
$54,639
Purchase Details
Closed on
Jun 27, 2014
Sold by
Prodigy Custom Homes Inc
Bought by
Kuhta John and Kuhta Karen Jo
Home Financials for this Owner
Home Financials are based on the most recent Mortgage that was taken out on this home.
Original Mortgage
$300,000
Interest Rate
4.17%
Mortgage Type
New Conventional
Purchase Details
Closed on
Jan 6, 2014
Sold by
Westcliffe Llc
Bought by
Prodigy Custom Homes Inc
Create a Home Valuation Report for This Property
The Home Valuation Report is an in-depth analysis detailing your home's value as well as a comparison with similar homes in the area
Home Values in the Area
Average Home Value in this Area
Purchase History
| Date | Buyer | Sale Price | Title Company |
|---|---|---|---|
| Walker Troy | $815,000 | Chicago Title | |
| Kuhta John | $456,255 | Stewart Title Co | |
| Prodigy Custom Homes Inc | $94,000 | Cascade Title |
Source: Public Records
Mortgage History
| Date | Status | Borrower | Loan Amount |
|---|---|---|---|
| Open | Walker Troy | $774,250 | |
| Previous Owner | Kuhta John | $300,000 |
Source: Public Records
Tax History Compared to Growth
Tax History
| Year | Tax Paid | Tax Assessment Tax Assessment Total Assessment is a certain percentage of the fair market value that is determined by local assessors to be the total taxable value of land and additions on the property. | Land | Improvement |
|---|---|---|---|---|
| 2024 | $6,218 | $700,050 | $150,000 | $550,050 |
| 2023 | $6,218 | $667,700 | $150,000 | $517,700 |
| 2022 | $5,584 | $554,450 | $150,000 | $404,450 |
| 2021 | $5,452 | $505,920 | $150,000 | $355,920 |
| 2020 | $5,831 | $473,560 | $150,000 | $323,560 |
| 2019 | $5,245 | $479,130 | $87,750 | $391,380 |
| 2018 | $5,424 | $463,470 | $87,750 | $375,720 |
| 2017 | $4,798 | $400,850 | $87,750 | $313,100 |
| 2016 | $4,730 | $400,850 | $87,750 | $313,100 |
| 2015 | $4,821 | $400,850 | $87,750 | $313,100 |
| 2014 | -- | $400,850 | $87,750 | $313,100 |
| 2013 | -- | $87,750 | $87,750 | $0 |
Source: Public Records
Map
Nearby Homes
- 1638 Naples Ln
- 1614 Pisa Ln
- 1953 Gala Way
- 1604 Sorrento Ln
- 1660 Sicily Ln
- 1616 Verona Ln
- 1644 Molly Marie Ave
- 656 Lago Vista Dr
- 1232 N Bermuda Rd
- 661 Nuvola Vista Ct
- 3006 N Bermuda Rd
- 585 Burton Ct
- 1276 N Bermuda Rd
- 1376 Tuscany Place
- 2150 Legacy Ln
- 1352 Westgate Way
- 3776 Corvina St
- The Canyon Plan at Peach Tree Estates
- 676 Snowking St
- 660 Snowking St
- 1634 Sorrento Ln
- 1634 Sorrento Ln Unit "The Beethoven" by P
- 1646 Sorrento Ln
- 1646 Sorrento Ln Unit STUNNING VIEW HOME!
- 1632 Naples Ln
- 1638 Naples Ln Unit VIEWS!
- 1628 Sorrento Ln
- 1632 Pisa Ln
- 1626 Naples Ln
- 1626 Naples Ln Unit Presale for Comp Pur
- 1644 Pisa Ln
- 1652 Sorrento Ln
- 1626 Pisa Ln
- 1650 Pisa Ln
- 1644 Naples Ln
- 1620 Naples Ln
- 1622 Sorrento Ln
- 1620 Pisa Ln
- 1620 Pisa Ln Unit Lot 4, Block 1, Phas
- 1620 Pisa Ln Unit Luxury Build for Com