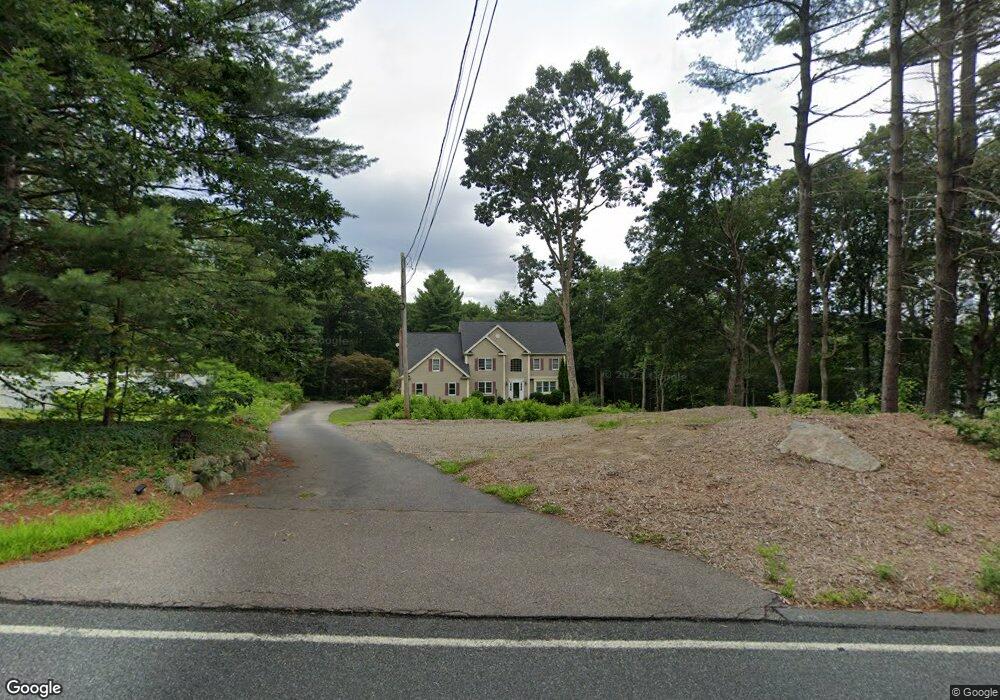
1640 West St Wrentham, MA 02093
West Wrentham NeighborhoodEstimated Value: $1,067,725 - $1,631,000
4
Beds
3
Baths
3,327
Sq Ft
$369/Sq Ft
Est. Value
About This Home
This home is located at 1640 West St, Wrentham, MA 02093 and is currently estimated at $1,228,431, approximately $369 per square foot. 1640 West St is a home located in Norfolk County with nearby schools including Delaney Elementary School, Charles E Roderick, and Mercymount Country Day School.
Ownership History
Date
Name
Owned For
Owner Type
Purchase Details
Closed on
Oct 6, 1998
Sold by
Spillane Tr Chris and Spillane Tr Nora T
Bought by
Shain Randall H and Shain Cynthia J
Current Estimated Value
Home Financials for this Owner
Home Financials are based on the most recent Mortgage that was taken out on this home.
Original Mortgage
$262,500
Interest Rate
6.89%
Mortgage Type
Purchase Money Mortgage
Purchase Details
Closed on
Apr 24, 1998
Sold by
Giberti Eleanor L
Bought by
Spillane Tr C and Spillane Nora T
Create a Home Valuation Report for This Property
The Home Valuation Report is an in-depth analysis detailing your home's value as well as a comparison with similar homes in the area
Home Values in the Area
Average Home Value in this Area
Purchase History
| Date | Buyer | Sale Price | Title Company |
|---|---|---|---|
| Shain Randall H | $375,000 | -- | |
| Spillane Tr C | $94,200 | -- |
Source: Public Records
Mortgage History
| Date | Status | Borrower | Loan Amount |
|---|---|---|---|
| Open | Spillane Tr C | $317,000 | |
| Closed | Spillane Tr C | $335,000 | |
| Closed | Spillane Tr C | $289,000 | |
| Closed | Spillane Tr C | $262,500 |
Source: Public Records
Tax History
| Year | Tax Paid | Tax Assessment Tax Assessment Total Assessment is a certain percentage of the fair market value that is determined by local assessors to be the total taxable value of land and additions on the property. | Land | Improvement |
|---|---|---|---|---|
| 2025 | $10,520 | $907,700 | $288,100 | $619,600 |
| 2024 | $10,006 | $833,800 | $288,100 | $545,700 |
| 2023 | $10,104 | $800,600 | $262,000 | $538,600 |
| 2022 | $9,718 | $710,900 | $255,200 | $455,700 |
| 2021 | $9,268 | $658,700 | $238,500 | $420,200 |
| 2020 | $9,153 | $642,300 | $182,100 | $460,200 |
| 2019 | $8,524 | $603,700 | $163,900 | $439,800 |
| 2018 | $8,121 | $570,300 | $163,800 | $406,500 |
| 2017 | $7,860 | $551,600 | $160,600 | $391,000 |
| 2016 | $7,765 | $543,800 | $156,000 | $387,800 |
| 2015 | $8,109 | $541,300 | $166,600 | $374,700 |
| 2014 | $8,165 | $533,300 | $160,200 | $373,100 |
Source: Public Records
Map
Nearby Homes
- 1620 West St
- 1565 West St
- 10 Follett Dr
- 60 Grant Ave
- 9 Reagan Ave
- 2095 West St
- 172 Pine Swamp Rd
- 180 Pine Swamp Rd
- 56 Pine Swamp Rd
- 365 W Wrentham Rd
- 25 Nature View Dr
- 900 Washington St Lot 2
- 47 Austin Dr
- 20 Nature View Dr
- 11 Amber Dr
- 955 Summer St
- 20 Field Cir
- 925 Washington St
- 613 West St
- 1 Spring St
Your Personal Tour Guide
Ask me questions while you tour the home.