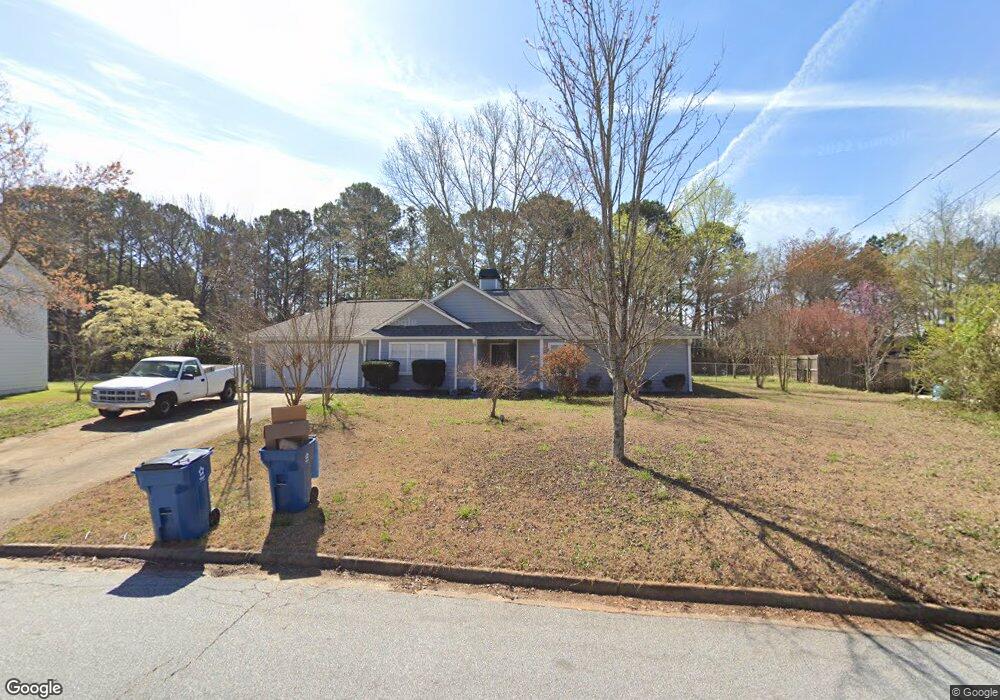
1640 Willow Bend Way Snellville, GA 30078
Estimated Value: $320,000 - $350,815
3
Beds
2
Baths
1,674
Sq Ft
$201/Sq Ft
Est. Value
About This Home
This home is located at 1640 Willow Bend Way, Snellville, GA 30078 and is currently estimated at $335,704, approximately $200 per square foot. 1640 Willow Bend Way is a home located in Gwinnett County with nearby schools including Pharr Elementary School, Couch Middle School, and Grayson High School.
Ownership History
Date
Name
Owned For
Owner Type
Purchase Details
Closed on
Mar 12, 2012
Sold by
Citimortgage Inc
Bought by
Midnight Fox Real Estate Inves
Current Estimated Value
Purchase Details
Closed on
Nov 1, 2011
Sold by
Ortega Jose R
Bought by
Citimortgage Inc
Purchase Details
Closed on
Nov 20, 2001
Sold by
Ortega Jose R
Bought by
Ortega Jose R
Home Financials for this Owner
Home Financials are based on the most recent Mortgage that was taken out on this home.
Original Mortgage
$118,805
Interest Rate
7.02%
Mortgage Type
FHA
Purchase Details
Closed on
Dec 15, 1999
Sold by
Madera Angel F and Madera Beatriz
Bought by
Ortega Jose R
Home Financials for this Owner
Home Financials are based on the most recent Mortgage that was taken out on this home.
Original Mortgage
$116,650
Interest Rate
7.85%
Mortgage Type
FHA
Create a Home Valuation Report for This Property
The Home Valuation Report is an in-depth analysis detailing your home's value as well as a comparison with similar homes in the area
Home Values in the Area
Average Home Value in this Area
Purchase History
| Date | Buyer | Sale Price | Title Company |
|---|---|---|---|
| Midnight Fox Real Estate Inves | $57,000 | -- | |
| Citimortgage Inc | $46,204 | -- | |
| Ortega Jose R | -- | -- | |
| Ortega Jose R | -- | -- | |
| Ortega Jose R | $118,000 | -- |
Source: Public Records
Mortgage History
| Date | Status | Borrower | Loan Amount |
|---|---|---|---|
| Previous Owner | Ortega Jose R | $118,805 | |
| Previous Owner | Ortega Jose R | $116,650 |
Source: Public Records
Tax History Compared to Growth
Tax History
| Year | Tax Paid | Tax Assessment Tax Assessment Total Assessment is a certain percentage of the fair market value that is determined by local assessors to be the total taxable value of land and additions on the property. | Land | Improvement |
|---|---|---|---|---|
| 2025 | $4,601 | $119,840 | $26,120 | $93,720 |
| 2024 | $4,709 | $121,600 | $26,120 | $95,480 |
| 2023 | $4,709 | $115,520 | $24,200 | $91,320 |
| 2022 | $4,081 | $104,920 | $22,000 | $82,920 |
| 2021 | $2,983 | $73,040 | $14,800 | $58,240 |
| 2020 | $2,232 | $51,920 | $14,800 | $37,120 |
| 2019 | $2,726 | $68,320 | $14,800 | $53,520 |
| 2018 | $2,365 | $58,080 | $12,000 | $46,080 |
| 2016 | $1,963 | $46,080 | $10,000 | $36,080 |
| 2015 | $1,982 | $46,080 | $10,000 | $36,080 |
| 2014 | $1,573 | $34,440 | $8,000 | $26,440 |
Source: Public Records
Map
Nearby Homes
- 1621 Annapolis Way
- 1520 Natchez Way
- 1418 Georgetown Way
- 1405 Wilmington Way Unit 4
- 1737 Litchfield Rd
- 1455 Timberlane Rd
- 2050 Woodberry Run Dr
- 1430 Roanoke Trace
- 1757 Litchfield Rd Unit 3
- 2080 Woodberry Run Dr
- 1603 Glenwood Way Unit 1
- 1832 Glenwood Ln
- 1676 Heritage Dr
- 1913 Raintree Ct
- 1327 Cotton Creek Dr
- 1269 Gate Post Ln
- 1640 Willow Bend Way
- 1630 Willow Bend Way
- 1630 Willow Bend Way Unit 4
- 1650 Willow Bend Way
- 1490 North Rd SW
- 1490 North Rd
- 1620 Willow Bend Way
- 1641 Willow Bend Way
- 1651 Willow Bend Way
- 1610 Willow Bend Way
- 1631 Willow Bend Way
- 1621 Willow Bend Way
- 1600 Willow Bend Way
- 1454 North Rd
- 1611 Willow Bend Way
- 1591 Annapolis Way
- 1450 North Rd
- 1601 Willow Bend Way Unit I
- 1601 Annapolis Way
- 1581 Annapolis Way