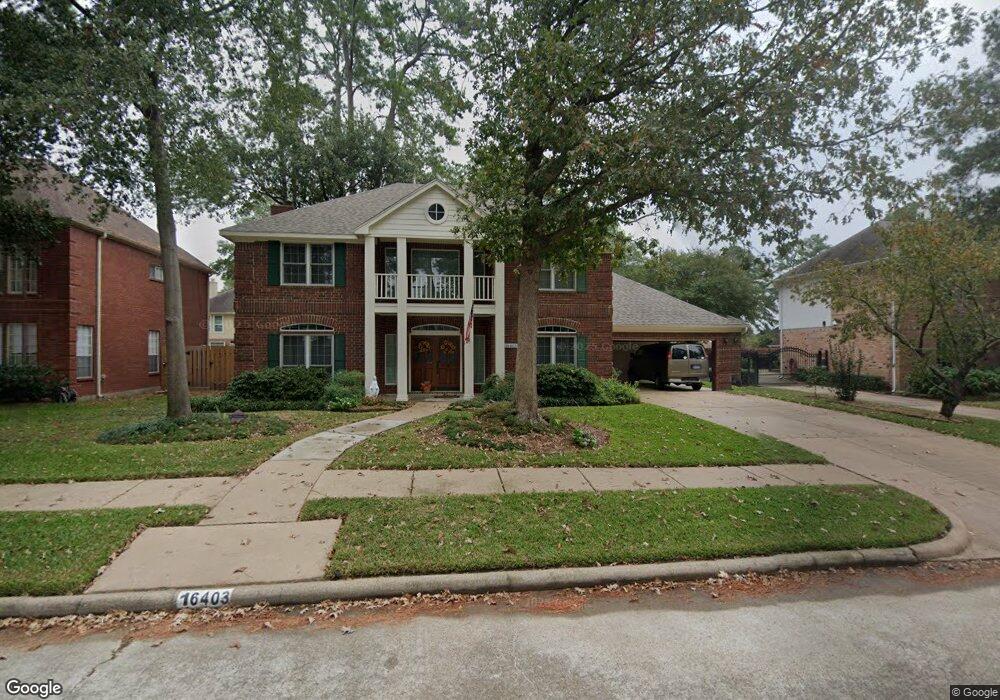
16403 Avenplace Rd Tomball, TX 77377
Estimated Value: $358,708 - $406,000
4
Beds
3
Baths
2,864
Sq Ft
$132/Sq Ft
Est. Value
About This Home
This home is located at 16403 Avenplace Rd, Tomball, TX 77377 and is currently estimated at $377,927, approximately $131 per square foot. 16403 Avenplace Rd is a home located in Harris County with nearby schools including Lakewood Elementary School, Willow Wood Junior High School, and Northpointe Intermediate School.
Create a Home Valuation Report for This Property
The Home Valuation Report is an in-depth analysis detailing your home's value as well as a comparison with similar homes in the area
Home Values in the Area
Average Home Value in this Area
Tax History Compared to Growth
Tax History
| Year | Tax Paid | Tax Assessment Tax Assessment Total Assessment is a certain percentage of the fair market value that is determined by local assessors to be the total taxable value of land and additions on the property. | Land | Improvement |
|---|---|---|---|---|
| 2025 | $3,025 | $337,094 | $63,762 | $273,332 |
| 2024 | $3,025 | $350,837 | $63,762 | $287,075 |
| 2023 | $3,025 | $346,927 | $63,762 | $283,165 |
| 2022 | $6,200 | $316,804 | $53,083 | $263,721 |
| 2021 | $5,888 | $242,073 | $37,692 | $204,381 |
| 2020 | $5,815 | $230,657 | $37,692 | $192,965 |
| 2019 | $5,536 | $213,000 | $29,525 | $183,475 |
| 2018 | $2,519 | $213,000 | $29,525 | $183,475 |
| 2017 | $5,526 | $213,000 | $29,525 | $183,475 |
| 2016 | $5,609 | $216,200 | $29,525 | $186,675 |
| 2015 | $4,289 | $216,200 | $29,525 | $186,675 |
| 2014 | $4,289 | $180,000 | $29,525 | $150,475 |
Source: Public Records
Map
Nearby Homes
- 16218 Jordyn Lake Dr
- 16610 Avenfield Rd
- 12319 Hamsfield Ct
- 12502 Pavilion Ct
- 16855 E Maglitto Cir
- 12411 Exbury Ct
- 16723 Chewton Glen St
- 11815 Lakewood Hills Dr
- 12515 Pavilion Ct
- 16107 Sweetwater Fields Ln Unit B1
- 16106 Limestone Lake Dr
- 11814 Lake Grove Ct
- 17410 Pikes Peek Ct
- 12427 Pedder Way Dr
- 16030 Summerville Lake Dr
- 16012 Summerville Lake Dr
- 12209 Medina Lake Dr
- 12502 Wealdstone Dr
- 12407 Wealdstone Dr
- 12422 Hammersmith Dr
- 16407 Avenplace Rd
- 16323 Avenplace Rd
- 16402 Willowpark Dr
- 16406 Willowpark Dr
- 16322 Willowpark Dr
- 16319 Avenplace Rd
- 16402 Avenplace Rd
- 16326 Avenplace Rd
- 16411 Avenplace Rd
- 16318 Willowpark Dr
- 16406 Avenplace Rd
- 16410 Willowpark Dr
- 16322 Avenplace Rd
- 16415 Avenplace Rd
- 16315 Avenplace Rd
- 16403 Willowpark Dr
- 16410 Avenplace Rd
- 16414 Willowpark Dr
- 16323 Willowpark Dr
- 16314 Willowpark Dr