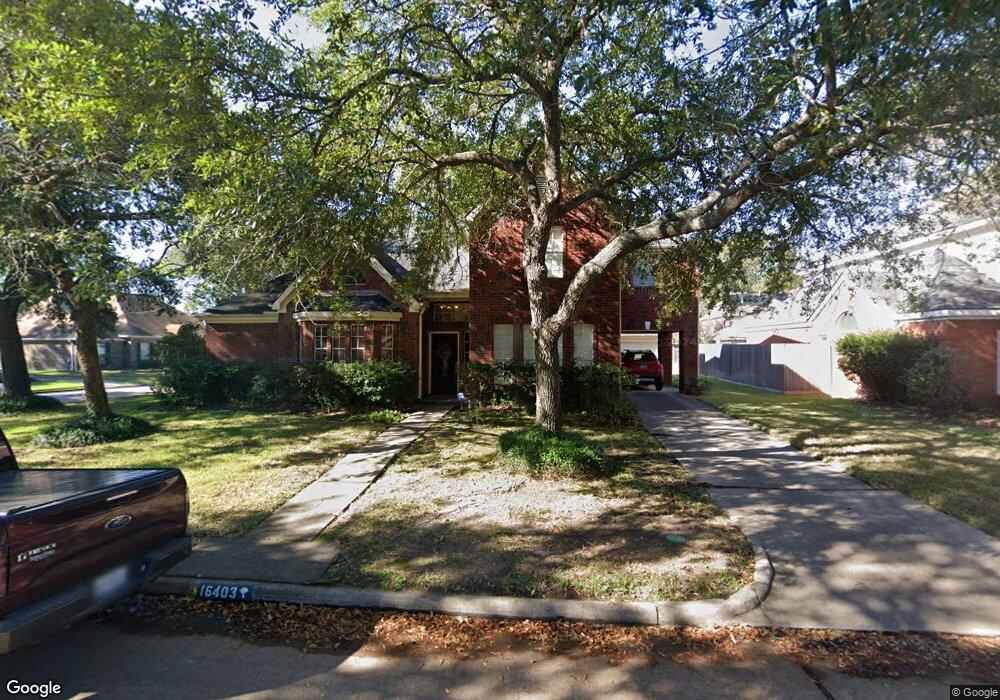
16403 Carlton Vale Ct Tomball, TX 77377
Estimated Value: $433,880 - $491,000
4
Beds
4
Baths
3,310
Sq Ft
$138/Sq Ft
Est. Value
About This Home
This home is located at 16403 Carlton Vale Ct, Tomball, TX 77377 and is currently estimated at $457,970, approximately $138 per square foot. 16403 Carlton Vale Ct is a home located in Harris County with nearby schools including Lakewood Elementary School, Willow Wood Junior High School, and Northpointe Intermediate School.
Ownership History
Date
Name
Owned For
Owner Type
Purchase Details
Closed on
Sep 27, 2024
Sold by
Mccathren Allison C
Bought by
Mccathren Allison C
Current Estimated Value
Purchase Details
Closed on
Aug 28, 2015
Sold by
Luther David and Luther Audrey
Bought by
Mccathren Allison C and Mc Cathren Robert E
Home Financials for this Owner
Home Financials are based on the most recent Mortgage that was taken out on this home.
Original Mortgage
$226,000
Interest Rate
4.08%
Mortgage Type
New Conventional
Purchase Details
Closed on
Apr 30, 2004
Sold by
Lalor Richard C and Lalor Deborah L
Bought by
Luther David and Luther Audrey
Home Financials for this Owner
Home Financials are based on the most recent Mortgage that was taken out on this home.
Original Mortgage
$152,000
Interest Rate
5.38%
Mortgage Type
Purchase Money Mortgage
Create a Home Valuation Report for This Property
The Home Valuation Report is an in-depth analysis detailing your home's value as well as a comparison with similar homes in the area
Home Values in the Area
Average Home Value in this Area
Purchase History
| Date | Buyer | Sale Price | Title Company |
|---|---|---|---|
| Mccathren Allison C | -- | None Listed On Document | |
| Mccathren Allison C | -- | Stewart Title | |
| Luther David | -- | First American Title |
Source: Public Records
Mortgage History
| Date | Status | Borrower | Loan Amount |
|---|---|---|---|
| Previous Owner | Mccathren Allison C | $226,000 | |
| Previous Owner | Luther David | $152,000 | |
| Closed | Luther David | $28,500 |
Source: Public Records
Tax History Compared to Growth
Tax History
| Year | Tax Paid | Tax Assessment Tax Assessment Total Assessment is a certain percentage of the fair market value that is determined by local assessors to be the total taxable value of land and additions on the property. | Land | Improvement |
|---|---|---|---|---|
| 2025 | $7,283 | $440,659 | $74,119 | $366,540 |
| 2024 | $7,283 | $450,286 | $74,119 | $376,167 |
| 2023 | $7,283 | $465,999 | $71,675 | $394,324 |
| 2022 | $7,843 | $386,694 | $61,494 | $325,200 |
| 2021 | $7,449 | $317,630 | $44,797 | $272,833 |
| 2020 | $7,019 | $278,385 | $42,761 | $235,624 |
| 2019 | $7,235 | $278,385 | $38,360 | $240,025 |
| 2018 | $3,258 | $268,134 | $33,246 | $234,888 |
| 2017 | $6,957 | $268,134 | $33,246 | $234,888 |
| 2016 | $6,957 | $268,134 | $33,246 | $234,888 |
| 2015 | $5,409 | $268,134 | $33,246 | $234,888 |
| 2014 | $5,409 | $227,272 | $33,246 | $194,026 |
Source: Public Records
Map
Nearby Homes
- 12502 Wealdstone Dr
- 12515 Pavilion Ct
- 12422 Hammersmith Dr
- 12502 Pavilion Ct
- 12407 Wealdstone Dr
- 12411 Exbury Ct
- 16610 Avenfield Rd
- 12319 Hamsfield Ct
- 12906 Ivyforest Dr
- 13206 Chriswood Dr
- 13210 Chriswood Dr
- 15843 Collinsville Dr
- 12903 Cluster Pine Dr
- 15826 Collinsville Dr
- 16723 Chewton Glen St
- 12610 Ivyforest Dr
- 12209 Medina Lake Dr
- 16107 Sweetwater Fields Ln Unit B1
- 12943 Spring Cypress Rd
- 16012 Summerville Lake Dr
- 16407 Carlton Vale Ct
- 16402 Finborough Dr
- 16411 Carlton Vale Ct
- 16406 Finborough Dr
- 12519 New Hampton Dr
- 12523 New Hampton Dr
- 16402 Carlton Vale Ct
- 16406 Carlton Vale Ct
- 12515 New Hampton Dr
- 12527 New Hampton Dr
- 16410 Finborough Dr
- 16410 Carlton Vale Ct
- 16415 Carlton Vale Ct
- 12511 New Hampton Dr
- 16414 Carlton Vale Ct
- 12531 New Hampton Dr
- 16414 Finborough Dr
- 12518 Wealdstone Dr
- 12522 Wealdstone Dr
- 12507 New Hampton Dr