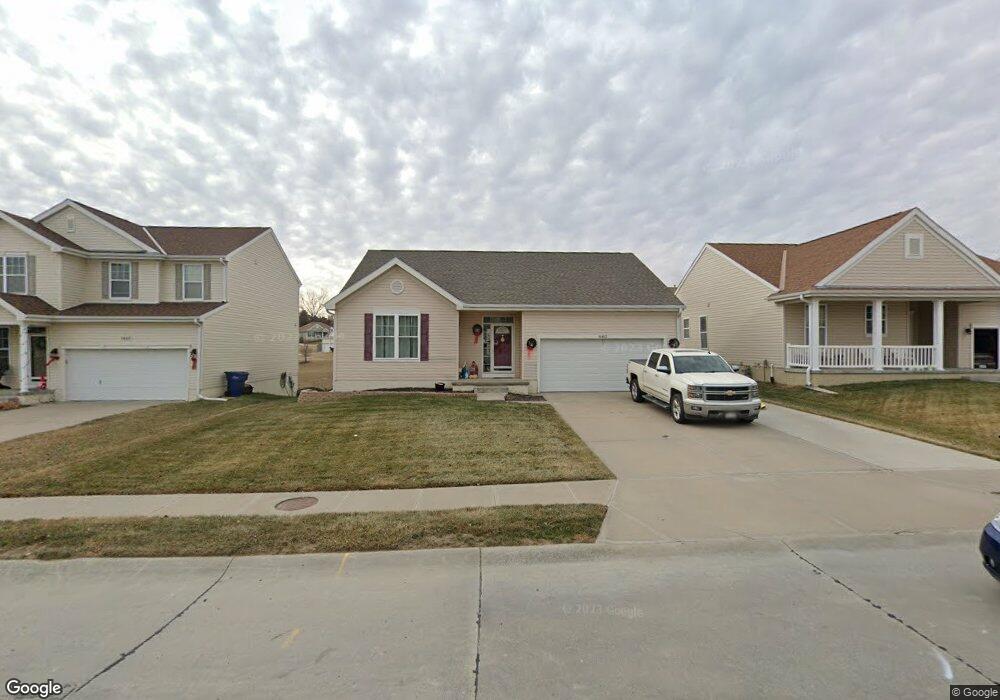
16403 Loop St Omaha, NE 68136
Southwest Omaha NeighborhoodEstimated Value: $336,000 - $346,000
About This Home
This home is located at 16403 Loop St, Omaha, NE 68136 and is currently estimated at $340,624, approximately $250 per square foot. 16403 Loop St is a home located in Sarpy County with nearby schools including Upchurch Elementary School, Millard South High School, and Harry Andersen Middle School.
Ownership History
We collect this data history from publicly available records. To have your information removed, we recommend requesting removal directly through your county’s website.
Purchase Details
Purchase Details
Home Financials for this Owner
Home Financials are based on the most recent Mortgage that was taken out on this home.Home Values in the Area
Average Home Value in this Area
Purchase History
We collect this data history from publicly available records. To have your information removed, we recommend requesting removal directly through your county’s website.
| Date | Buyer | Sale Price | Title Company |
|---|---|---|---|
| -- | None Available | ||
| $136,000 | Fat |
Mortgage History
We collect this data history from publicly available records. To have your information removed, we recommend requesting removal directly through your county’s website.
| Date | Status | Borrower | Loan Amount |
|---|---|---|---|
| Open | $59,000 | ||
| Open | $135,592 |
Tax History
We collect this data history from publicly available records. To have your information removed, we recommend requesting removal directly through your county’s website.
| Year | Tax Paid | Tax Assessment Tax Assessment Total Assessment is a certain percentage of the fair market value that is determined by local assessors to be the total taxable value of land and additions on the property. | Land | Improvement |
|---|---|---|---|---|
| 2025 | $3,375 | $322,984 | $60,000 | $262,984 |
| 2024 | $3,655 | $301,223 | $58,000 | $243,223 |
| 2023 | $3,655 | $255,276 | $49,000 | $206,276 |
| 2022 | $5,490 | $241,058 | $41,000 | $200,058 |
| 2021 | $5,066 | $215,462 | $41,000 | $174,462 |
| 2020 | $5,025 | $211,449 | $41,000 | $170,449 |
| 2019 | $4,818 | $199,023 | $41,000 | $158,023 |
| 2018 | $4,457 | $177,271 | $35,000 | $142,271 |
| 2017 | $4,520 | $175,144 | $35,000 | $140,144 |
| 2016 | $4,304 | $162,772 | $35,000 | $127,772 |
| 2015 | $4,127 | $154,179 | $35,000 | $119,179 |
| 2014 | $3,987 | $146,923 | $35,000 | $111,923 |
| 2012 | -- | $147,285 | $35,000 | $112,285 |
Map
- 16305 Loop St
- 8903 S 163rd St
- 8701 S 163rd Ave
- 8911 S 167th St
- 16454 Virginia St
- 16907 Greenfield St
- 16852 Portal St
- 17021 Aurora St
- 17022 Centennial Rd
- 16812 Colony Cir
- 8112 S 166th St
- 16906 Colony Dr
- 16260 Sage St
- TBD Redwood St
- Lot 143 Garden Oaks
- 16507 Briar St
- 8008 S 161st Terrace
- 17242 Musket St
- 16378 Cheyenne Rd
- 9601 S 173rd Ave
Ask me questions while you tour the home.