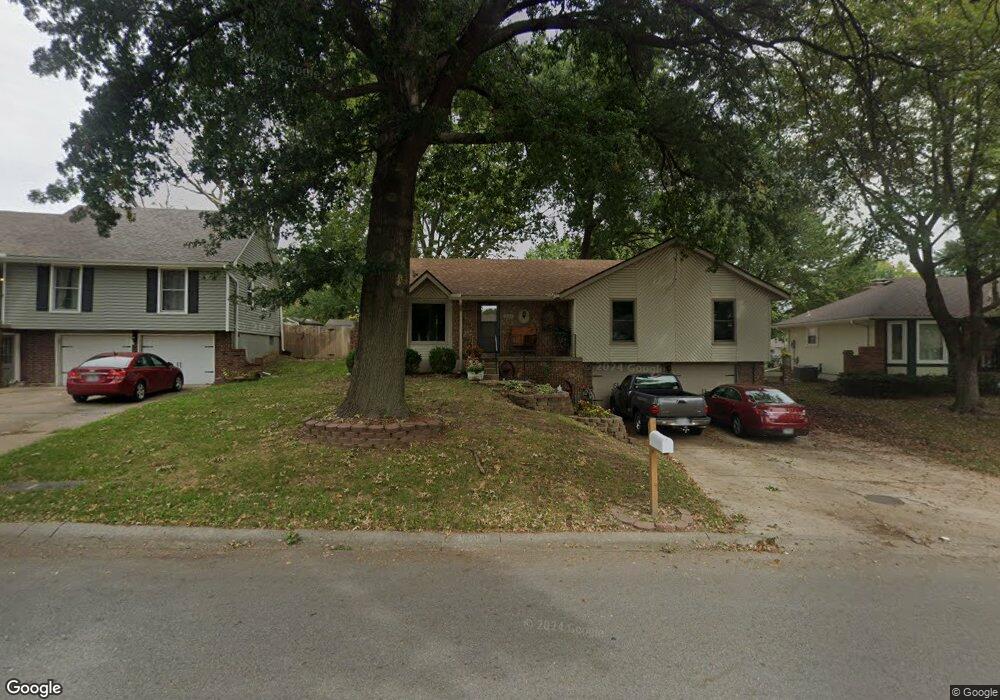
16404 S Cogan Dr Independence, MO 64055
Glendale NeighborhoodEstimated Value: $237,257 - $275,000
3
Beds
2
Baths
1,464
Sq Ft
$174/Sq Ft
Est. Value
About This Home
This home is located at 16404 S Cogan Dr, Independence, MO 64055 and is currently estimated at $254,814, approximately $174 per square foot. 16404 S Cogan Dr is a home located in Jackson County with nearby schools including Glendale Elementary School, Bridger Middle School, and Pioneer Ridge Middle School.
Ownership History
Date
Name
Owned For
Owner Type
Purchase Details
Closed on
Apr 25, 2023
Sold by
Harness Wayne E and Harness Lisa
Bought by
Harness Wayne E and Harness Lisa
Current Estimated Value
Purchase Details
Closed on
Jul 25, 2008
Sold by
Harness Anita L
Bought by
Harness Wayne E
Purchase Details
Closed on
Nov 16, 2005
Sold by
Tiensvold James L and Tiensvold Katherine L
Bought by
Harness Wayne E and Harness Anita L
Home Financials for this Owner
Home Financials are based on the most recent Mortgage that was taken out on this home.
Original Mortgage
$116,000
Interest Rate
5.92%
Mortgage Type
Fannie Mae Freddie Mac
Create a Home Valuation Report for This Property
The Home Valuation Report is an in-depth analysis detailing your home's value as well as a comparison with similar homes in the area
Home Values in the Area
Average Home Value in this Area
Purchase History
| Date | Buyer | Sale Price | Title Company |
|---|---|---|---|
| Harness Wayne E | -- | None Listed On Document | |
| Harness Wayne E | -- | None Available | |
| Harness Wayne E | -- | -- | |
| Harness Wayne E | -- | -- |
Source: Public Records
Mortgage History
| Date | Status | Borrower | Loan Amount |
|---|---|---|---|
| Previous Owner | Harness Wayne E | $116,000 |
Source: Public Records
Tax History
| Year | Tax Paid | Tax Assessment Tax Assessment Total Assessment is a certain percentage of the fair market value that is determined by local assessors to be the total taxable value of land and additions on the property. | Land | Improvement |
|---|---|---|---|---|
| 2025 | $2,494 | $41,403 | $5,645 | $35,758 |
| 2024 | $2,494 | $36,003 | $4,482 | $31,521 |
| 2023 | $2,438 | $36,003 | $3,963 | $32,040 |
| 2022 | $2,316 | $31,350 | $4,307 | $27,043 |
| 2021 | $2,315 | $31,350 | $4,307 | $27,043 |
| 2020 | $2,085 | $27,435 | $4,307 | $23,128 |
| 2019 | $2,051 | $27,435 | $4,307 | $23,128 |
| 2018 | $1,870 | $23,877 | $3,748 | $20,129 |
| 2017 | $1,853 | $23,877 | $3,748 | $20,129 |
| 2016 | $1,853 | $23,425 | $3,914 | $19,511 |
| 2014 | $1,760 | $22,743 | $3,800 | $18,943 |
Source: Public Records
Map
Nearby Homes
- 0 Multi Address N A Unit HMS2588688
- 2417 S Ellison Way
- 16403 E Ellison Way
- 15917 E 29th Street Ct S
- 2724 S Woodbury Dr
- 2705 S Haden Ct
- 2800 S Woodbury Dr
- 16409 E 31st St S
- 3105 Porter Rd
- 16600 E 31st St S
- 2816 Berry Ln
- 2824 Berry Ln
- 2608 Baker Rd
- 2900 S M 291 Hwy
- 2119 S Lees Summit Rd
- 16824 E 31st St S
- 3219 Vest St
- 2100 & 2105 S Ellison Way
- 915 S Trail Ridge Dr
- 16208 E Sea Ave
- 16400 E Cogan Dr
- 16408 S Cogan Dr
- 16400 S Cogan Dr
- 16320 E Cogan Dr
- 16405 E Gudgell Ct
- 16412 S Cogan Dr
- 16401 E Gudgell Ct
- 16401 E Cogan Dr
- 16405 E Cogan Dr
- 16319 E Cogan Dr
- 16316 E Cogan Dr
- 16409 E Gudgell Ct
- 16409 E Cogan Dr
- 16416 E Cogan Dr
- 16416 E Cogan Dr
- 16313 E Cogan Dr
- 16312 E Cogan Dr
- 16400 E Gudgell Ct
- 16413 E Gudgell Ct
- 2704 S Milton Dr
Your Personal Tour Guide
Ask me questions while you tour the home.