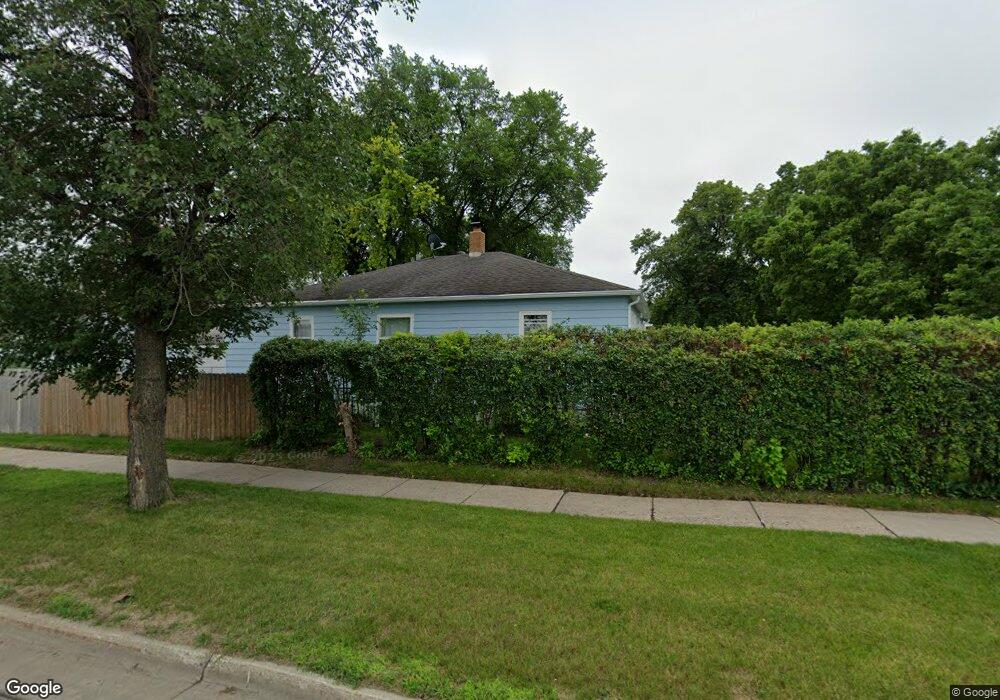
1641 8th St N Fargo, ND 58102
Washington NeighborhoodEstimated Value: $234,000 - $272,611
4
Beds
2
Baths
1,800
Sq Ft
$138/Sq Ft
Est. Value
About This Home
This home is located at 1641 8th St N, Fargo, ND 58102 and is currently estimated at $248,653, approximately $138 per square foot. 1641 8th St N is a home located in Cass County with nearby schools including Washington Elementary School, Ben Franklin Middle School, and North High School.
Ownership History
Date
Name
Owned For
Owner Type
Purchase Details
Closed on
Jul 5, 2017
Sold by
Nicolai James Edward
Bought by
Nowicki Peter D
Current Estimated Value
Home Financials for this Owner
Home Financials are based on the most recent Mortgage that was taken out on this home.
Original Mortgage
$171,830
Outstanding Balance
$145,535
Interest Rate
4.62%
Mortgage Type
FHA
Estimated Equity
$103,118
Purchase Details
Closed on
Feb 23, 2015
Sold by
Nicolai Veltis
Bought by
Nicolai James Edward
Purchase Details
Closed on
Sep 17, 2012
Sold by
J & S Northstar West Llc
Bought by
Nicolai James E
Home Financials for this Owner
Home Financials are based on the most recent Mortgage that was taken out on this home.
Original Mortgage
$133,950
Interest Rate
3.58%
Mortgage Type
New Conventional
Purchase Details
Closed on
Nov 10, 2006
Sold by
Bjorkman Sandra and Bjorkman Jeffrey A
Bought by
J & S Northstar West Llc
Create a Home Valuation Report for This Property
The Home Valuation Report is an in-depth analysis detailing your home's value as well as a comparison with similar homes in the area
Home Values in the Area
Average Home Value in this Area
Purchase History
| Date | Buyer | Sale Price | Title Company |
|---|---|---|---|
| Nowicki Peter D | $175,000 | Fm Title | |
| Nicolai James Edward | -- | None Available | |
| Nicolai James E | $141,000 | Fm Title | |
| J & S Northstar West Llc | -- | -- |
Source: Public Records
Mortgage History
| Date | Status | Borrower | Loan Amount |
|---|---|---|---|
| Open | Nowicki Peter D | $171,830 | |
| Previous Owner | Nicolai James E | $133,950 |
Source: Public Records
Tax History Compared to Growth
Tax History
| Year | Tax Paid | Tax Assessment Tax Assessment Total Assessment is a certain percentage of the fair market value that is determined by local assessors to be the total taxable value of land and additions on the property. | Land | Improvement |
|---|---|---|---|---|
| 2024 | $3,597 | $111,450 | $20,050 | $91,400 |
| 2023 | $3,387 | $104,150 | $20,050 | $84,100 |
| 2022 | $3,377 | $102,100 | $20,050 | $82,050 |
| 2021 | $3,172 | $96,300 | $20,050 | $76,250 |
| 2020 | $3,092 | $91,700 | $20,050 | $71,650 |
| 2019 | $2,841 | $91,700 | $11,900 | $79,800 |
| 2018 | $2,478 | $80,600 | $11,900 | $68,700 |
| 2017 | $2,321 | $75,350 | $11,900 | $63,450 |
| 2016 | $1,903 | $68,500 | $11,900 | $56,600 |
| 2015 | $2,011 | $68,500 | $8,150 | $60,350 |
| 2014 | $1,962 | $64,900 | $8,150 | $56,750 |
| 2013 | $1,884 | $61,800 | $8,150 | $53,650 |
Source: Public Records
Map
Nearby Homes
- 1626 Broadway N
- 1610 9th St N
- 3216 Broadway N
- 1645 Broadway N
- 1625 11th St N
- 1538 10th St N
- 1626 11th St N
- 1629 12th St N
- 314 18th Ave N
- 1437 Broadway N Unit 102
- 1914 9th St N
- 1633 3rd St N
- 1822 3rd St N
- 917 14th Ave N
- 305 19th Ave N
- 1346 9th St N
- 1357 12th St N
- 1316 8th St N
- 2214 9 1 2 St N
- 1329 12th St N