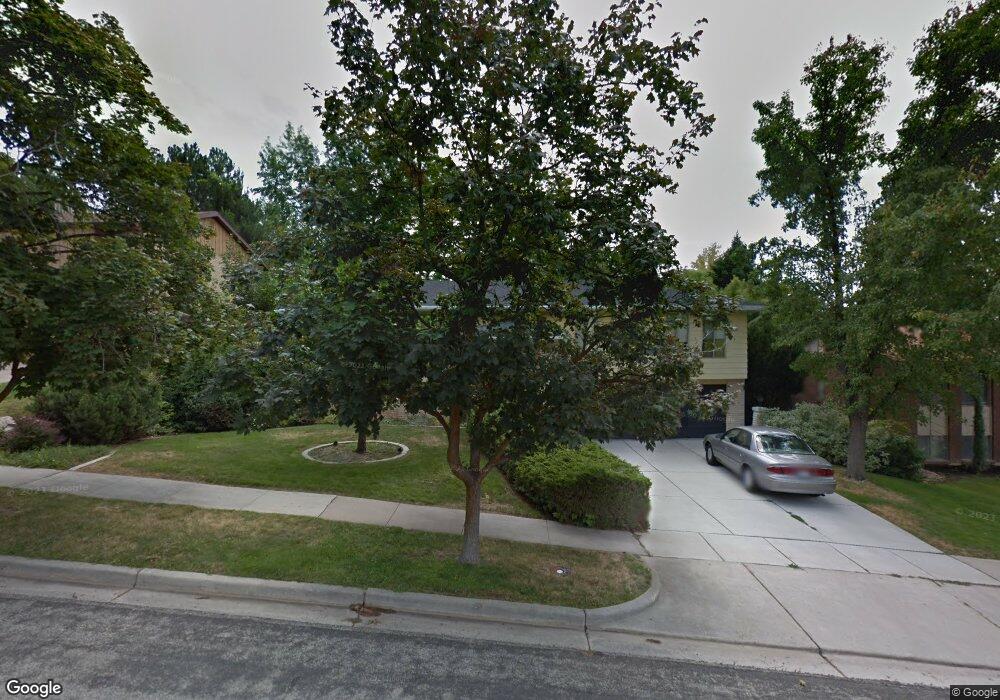
1641 Apache Way Ogden, UT 84403
Southeast Ogden NeighborhoodEstimated Value: $451,071 - $517,000
3
Beds
2
Baths
2,190
Sq Ft
$220/Sq Ft
Est. Value
About This Home
This home is located at 1641 Apache Way, Ogden, UT 84403 and is currently estimated at $481,768, approximately $219 per square foot. 1641 Apache Way is a home located in Weber County with nearby schools including Shadow Valley School, Mount Ogden Junior High School, and Ogden High School.
Ownership History
Date
Name
Owned For
Owner Type
Purchase Details
Closed on
Sep 20, 2021
Sold by
Poitevin John R and Poitevin Diane J
Bought by
Vaioleti Nathaly Elena and Araica Bayardo
Current Estimated Value
Home Financials for this Owner
Home Financials are based on the most recent Mortgage that was taken out on this home.
Original Mortgage
$374,245
Outstanding Balance
$340,535
Interest Rate
2.8%
Mortgage Type
FHA
Estimated Equity
$141,233
Purchase Details
Closed on
Dec 5, 2005
Sold by
Poitevin Doris G
Bought by
Poitevin John R and Poitevin Diane J
Home Financials for this Owner
Home Financials are based on the most recent Mortgage that was taken out on this home.
Original Mortgage
$128,000
Interest Rate
6.14%
Mortgage Type
Fannie Mae Freddie Mac
Purchase Details
Closed on
Feb 6, 1996
Sold by
Poitevin J Joe
Bought by
Poitevin J Joe
Create a Home Valuation Report for This Property
The Home Valuation Report is an in-depth analysis detailing your home's value as well as a comparison with similar homes in the area
Home Values in the Area
Average Home Value in this Area
Purchase History
| Date | Buyer | Sale Price | Title Company |
|---|---|---|---|
| Vaioleti Nathaly Elena | -- | Inwest Title | |
| Poitevin John R | -- | Mountain View Title | |
| Poitevin J Joe | -- | -- | |
| Poitevin Doris G | -- | -- |
Source: Public Records
Mortgage History
| Date | Status | Borrower | Loan Amount |
|---|---|---|---|
| Open | Vaioleti Nathaly Elena | $374,245 | |
| Previous Owner | Poitevin John R | $128,000 |
Source: Public Records
Tax History
| Year | Tax Paid | Tax Assessment Tax Assessment Total Assessment is a certain percentage of the fair market value that is determined by local assessors to be the total taxable value of land and additions on the property. | Land | Improvement |
|---|---|---|---|---|
| 2025 | $3,299 | $446,847 | $185,241 | $261,606 |
| 2024 | $3,261 | $240,899 | $101,882 | $139,017 |
| 2023 | $3,446 | $259,600 | $101,883 | $157,717 |
| 2022 | $3,267 | $246,951 | $85,795 | $161,156 |
| 2021 | $2,821 | $352,000 | $86,498 | $265,502 |
| 2020 | $2,671 | $308,000 | $67,062 | $240,938 |
| 2019 | $2,582 | $281,000 | $62,049 | $218,951 |
| 2018 | $2,368 | $256,000 | $59,148 | $196,852 |
| 2017 | $2,061 | $209,000 | $59,148 | $149,852 |
| 2016 | $1,910 | $105,349 | $29,579 | $75,770 |
| 2015 | $1,914 | $103,804 | $29,579 | $74,225 |
| 2014 | $1,904 | $102,128 | $26,897 | $75,231 |
Source: Public Records
Map
Nearby Homes
- 1762 Whispering Oaks Dr
- 1811 Shadow Valley Dr
- 1880 Shadow Valley Dr
- 5142 Sunset Way Unit 401
- 1860 Wasatch Dr
- 1921 Mohawk Ln
- 1303 Sunset Ct Unit 308
- 5135 Sunset Way Unit 410
- 4781 Canterbury Rd
- 1295 Sunset Ct
- 1302 Sunset Ct
- 4983 Quail Ln
- 5210 Skyline Pkwy
- 1333 E 5200 S
- 1314 E 5250 S
- 4857 Chukar Ln
- 5600 Meadow Ln Unit 193
- 1225 E 5275 S
- 1963 Cherokee Cir
- 4849 Nightingale Ln
- 1635 Apache Way
- 1647 Apache Way
- 5148 Pierce Ave
- 5157 Pierce Ave
- 1663 Apache Way
- 5138 Shawnee Ln
- 1636 Apache Way
- 1644 Apache Way
- 5150 Shawnee Ln
- 5121 Waco Dr Unit IL
- 1628 Apache Way
- 5154 Pierce Ave
- 5162 Shawnee Ln
- 1652 Apache Way
- 1674 Apache Way
- 5129 Waco Dr Unit IL
- 5176 Shawnee Ln
- 5179 Pierce Ave
- 5170 Pierce Ave
- 1679 Apache Way
Your Personal Tour Guide
Ask me questions while you tour the home.