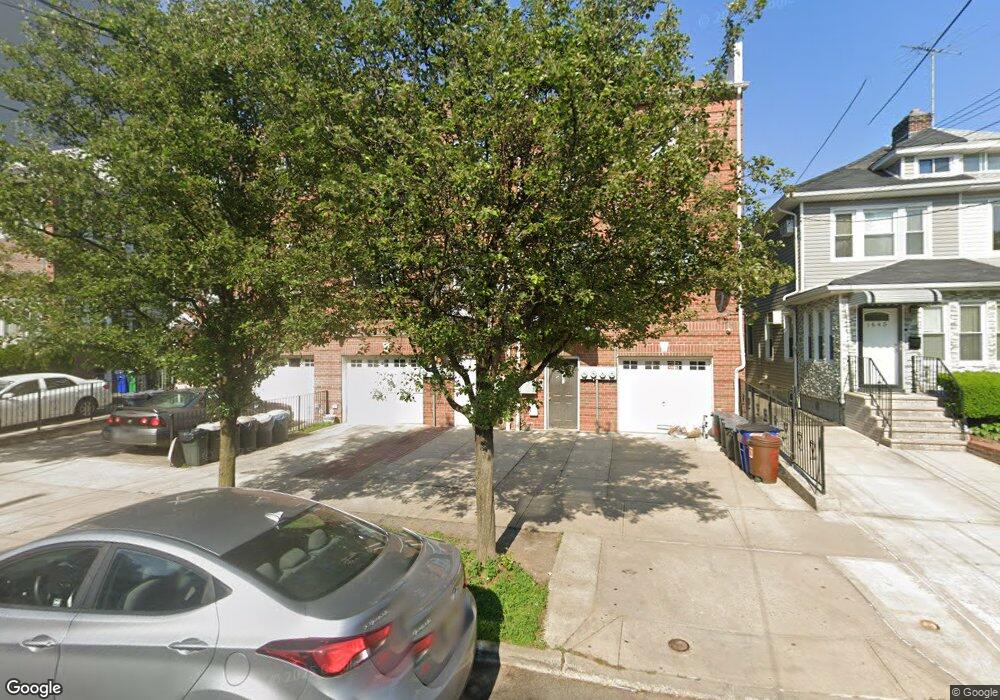
1641 Brooklyn Ave Unit 3 Brooklyn, NY 11210
East Flatbush NeighborhoodEstimated Value: $1,493,000 - $1,756,000
3
Beds
2
Baths
3,600
Sq Ft
$451/Sq Ft
Est. Value
About This Home
This home is located at 1641 Brooklyn Ave Unit 3, Brooklyn, NY 11210 and is currently estimated at $1,622,333, approximately $450 per square foot. 1641 Brooklyn Ave Unit 3 is a home located in Kings County with nearby schools including P.S. 109, Andries Hudde School, and Christian Heritage Academy.
Ownership History
Date
Name
Owned For
Owner Type
Purchase Details
Closed on
Mar 3, 2006
Sold by
Brunelle Alexandre As Trustee and Tchedly Victor As Trustee
Bought by
Corona Gardens Inc
Current Estimated Value
Home Financials for this Owner
Home Financials are based on the most recent Mortgage that was taken out on this home.
Original Mortgage
$675,000
Outstanding Balance
$366,134
Interest Rate
6.27%
Mortgage Type
Purchase Money Mortgage
Estimated Equity
$1,256,199
Purchase Details
Closed on
Feb 4, 2005
Sold by
Victor Wesline M
Bought by
Alexandre As Trustee Brunelle and Victor Premises Trust
Purchase Details
Closed on
Feb 3, 2005
Sold by
Victor Marie Rosine and Victor Victor
Bought by
Victor Wesline M
Create a Home Valuation Report for This Property
The Home Valuation Report is an in-depth analysis detailing your home's value as well as a comparison with similar homes in the area
Home Values in the Area
Average Home Value in this Area
Purchase History
We collect this data history from publicly available records. To have your information removed, we recommend requesting removal directly through your county’s website.
| Date | Buyer | Sale Price | Title Company |
|---|---|---|---|
| Corona Gardens Inc | $780,000 | -- | |
| Corona Gardens Inc | $780,000 | -- | |
| Alexandre As Trustee Brunelle | -- | -- | |
| Alexandre As Trustee Brunelle | -- | -- | |
| Victor Wesline M | -- | -- | |
| Victor Wesline M | -- | -- |
Source: Public Records
Mortgage History
We collect this data history from publicly available records. To have your information removed, we recommend requesting removal directly through your county’s website.
| Date | Status | Borrower | Loan Amount |
|---|---|---|---|
| Open | Corona Gardens Inc | $675,000 | |
| Closed | Corona Gardens Inc | $675,000 |
Source: Public Records
Tax History
| Year | Tax Paid | Tax Assessment Tax Assessment Total Assessment is a certain percentage of the fair market value that is determined by local assessors to be the total taxable value of land and additions on the property. | Land | Improvement |
|---|---|---|---|---|
| 2026 | $9,125 | $75,900 | $22,740 | $53,160 |
| 2025 | $8,608 | $57,720 | $22,740 | $34,980 |
| 2024 | $8,608 | $45,600 | $22,740 | $22,860 |
| 2023 | $8,212 | $55,260 | $22,740 | $32,520 |
| 2022 | $6,811 | $50,520 | $22,740 | $27,780 |
| 2021 | $5,164 | $55,380 | $22,740 | $32,640 |
| 2020 | $2,140 | $64,740 | $22,740 | $42,000 |
| 2019 | $2,977 | $51,480 | $22,740 | $28,740 |
| 2018 | $1,806 | $33,696 | $16,415 | $17,281 |
| 2017 | $1,806 | $33,696 | $20,271 | $13,425 |
| 2016 | $1,771 | $33,441 | $17,927 | $15,514 |
| 2015 | $1,210 | $31,549 | $21,881 | $9,668 |
| 2014 | $1,210 | $29,764 | $24,764 | $5,000 |
Source: Public Records
Map
Nearby Homes
- 997 E 37th St
- 1681 Brooklyn Ave
- 927 E 35th St
- 1558 Brooklyn Ave
- 3510 Avenue H Unit 3 H
- 3815 Glenwood Rd
- 1517 Brooklyn Ave
- 1513 Brooklyn Ave
- 3310 Avenue H Unit 5D
- 3215 Avenue H Unit 7G
- 3215 Avenue H Unit 11M
- 3215 Avenue H Unit 3P
- 3215 Avenue H Unit 11R
- 1655 Flatbush Ave Unit A1004
- 1655 Flatbush Ave Unit B1809
- 1655 Flatbush Ave Unit B1802
- 1655 Flatbush Ave Unit A1806
- 1655 Flatbush Ave Unit C1909
- 1655 Flatbush Ave Unit A1401
- 850 E 39th St
- 1625 Brooklyn Ave Unit 1
- 1625 Brooklyn Ave
- 1621 Avenue N
- 1621 Brooklyn Ave
- 1629 Brooklyn Ave Unit 2c
- 1629 Brooklyn Ave Unit 4C
- 1629 Brooklyn Ave Unit 2D
- 1629 Brooklyn Ave Unit 4B
- 1629 Brooklyn Ave
- 1617 Brooklyn Ave
- 1633 Brooklyn Ave
- 1613 Brooklyn Ave Unit 204
- 1611 Brooklyn Ave
- 954 E 37th St
- 956 E 37th St
- 952 E 37th St
- 1639 Brooklyn Ave
- 950 E 37th St
- 962 E 37th St
- 948 E 37th St
Your Personal Tour Guide
Ask me questions while you tour the home.