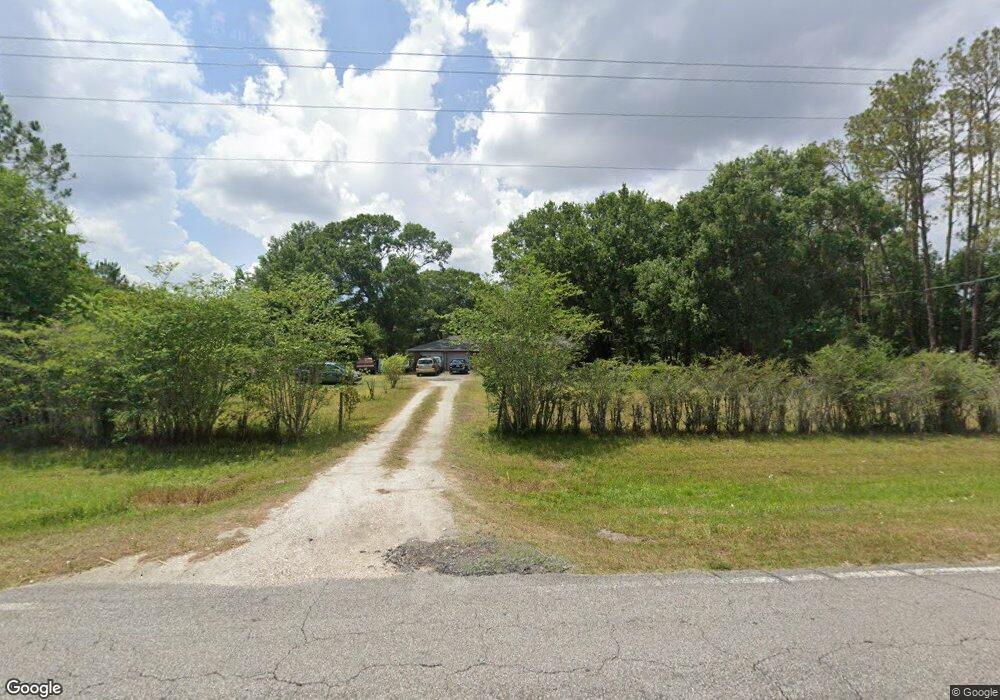
1641 Morris Bridge Rd Wesley Chapel, FL 33543
Estimated Value: $358,000 - $541,000
--
Bed
2
Baths
1,806
Sq Ft
$262/Sq Ft
Est. Value
About This Home
This home is located at 1641 Morris Bridge Rd, Wesley Chapel, FL 33543 and is currently estimated at $472,270, approximately $261 per square foot. 1641 Morris Bridge Rd is a home located in Pasco County with nearby schools including Chester W. Taylor, Jr. Elementary School, Raymond B. Stewart Middle School, and Zephyrhills High School.
Ownership History
Date
Name
Owned For
Owner Type
Purchase Details
Closed on
Mar 13, 2023
Sold by
Webb Bobby Lawrence
Bought by
Webb Bobby Lawrence and Polgar Jimie Kay
Current Estimated Value
Purchase Details
Closed on
Jan 27, 2015
Sold by
Webb Melissa
Bought by
Transki Chris A and Transki Margaret J
Purchase Details
Closed on
Oct 6, 2008
Sold by
Wedge Jennifer
Bought by
Webb Bobby and Wedge Jennifer
Purchase Details
Closed on
Jan 24, 2006
Sold by
Rivera David
Bought by
Webb Melissa and Webb Kristina
Purchase Details
Closed on
Jul 31, 2003
Sold by
Smith Edward L and Keesee Shirley A
Bought by
Rivera David and Transki Chris A
Home Financials for this Owner
Home Financials are based on the most recent Mortgage that was taken out on this home.
Original Mortgage
$185,000
Interest Rate
5.24%
Mortgage Type
New Conventional
Create a Home Valuation Report for This Property
The Home Valuation Report is an in-depth analysis detailing your home's value as well as a comparison with similar homes in the area
Home Values in the Area
Average Home Value in this Area
Purchase History
| Date | Buyer | Sale Price | Title Company |
|---|---|---|---|
| Webb Bobby Lawrence | $100 | -- | |
| Transki Chris A | $46,666 | Alpha Omega Title Svcs Inc | |
| Webb Bobby | -- | None Available | |
| Webb Melissa | -- | None Available | |
| Rivera David | $195,000 | Alday Donalson Title Agencie |
Source: Public Records
Mortgage History
| Date | Status | Borrower | Loan Amount |
|---|---|---|---|
| Previous Owner | Rivera David | $185,000 |
Source: Public Records
Tax History Compared to Growth
Tax History
| Year | Tax Paid | Tax Assessment Tax Assessment Total Assessment is a certain percentage of the fair market value that is determined by local assessors to be the total taxable value of land and additions on the property. | Land | Improvement |
|---|---|---|---|---|
| 2025 | $5,544 | $413,595 | $217,539 | $196,056 |
| 2024 | $5,544 | $401,458 | $208,539 | $192,919 |
| 2023 | $5,267 | $239,910 | $0 | $0 |
| 2022 | $4,508 | $381,020 | $208,539 | $172,481 |
| 2021 | $3,481 | $222,337 | $130,005 | $92,332 |
| 2020 | $3,050 | $180,262 | $90,405 | $89,857 |
| 2019 | $3,066 | $179,787 | $90,405 | $89,382 |
| 2018 | $2,993 | $175,009 | $90,405 | $84,604 |
| 2017 | $2,967 | $170,054 | $90,405 | $79,649 |
| 2016 | $2,912 | $166,816 | $90,405 | $76,411 |
| 2015 | $2,917 | $163,628 | $90,405 | $73,223 |
| 2014 | $2,819 | $161,135 | $90,405 | $70,730 |
Source: Public Records
Map
Nearby Homes
- Corina XL Plan at Shortgrass - Two Rivers
- Madeira II Plan at Shortgrass - Two Rivers
- Grandshore II Plan at Shortgrass - Two Rivers
- Windsor Plan at Shortgrass - Two Rivers
- Coronado II Plan at Shortgrass - Two Rivers
- Sonoma II Plan at Shortgrass - Two Rivers
- Corina III Plan at Shortgrass - Two Rivers
- Wentworth Plan at Shortgrass - Two Rivers
- Newport II Bonus Plan at Shortgrass - Two Rivers
- Sonoma Xl Plan at Shortgrass - Two Rivers
- Cypress Plan at Shortgrass - Two Rivers
- Santa Monica Plan at Shortgrass - Two Rivers
- Corina Bonus XL Plan at Shortgrass - Two Rivers
- Grandsail III Plan at Shortgrass - Two Rivers
- 34194 Grande Dominion Dr
- 1665 Rivulet Way
- 1701 Rivulet Way
- 1707 Rivulet Way
- 1674 Rivulet Way
- 1696 Rivulet Way
- 1609 Morris Bridge Rd
- 1719 Morris Bridge Rd
- 1734 Suttonset Trail
- 34271 Grande Dominion Dr
- 1756 Suttonset Trail
- 34628 Legacy Acres Dr
- 1771 Suttonset Trail
- 34502 Alger Point
- 1789 Suttonset Trail
- 34706 Legacy Acres Dr
- 1681 Drummond Point
- 1828 Upper Rd
- 1749 Morris Bridge Rd
- 33949 Mandrake Rd
- 1431 Morris Bridge Rd
- 33848 Mandrake Rd
- 33815 Mandrake Rd
- 1548 Upper Rd
- 33912 Mandrake Rd
- 33840 Mandrake Rd