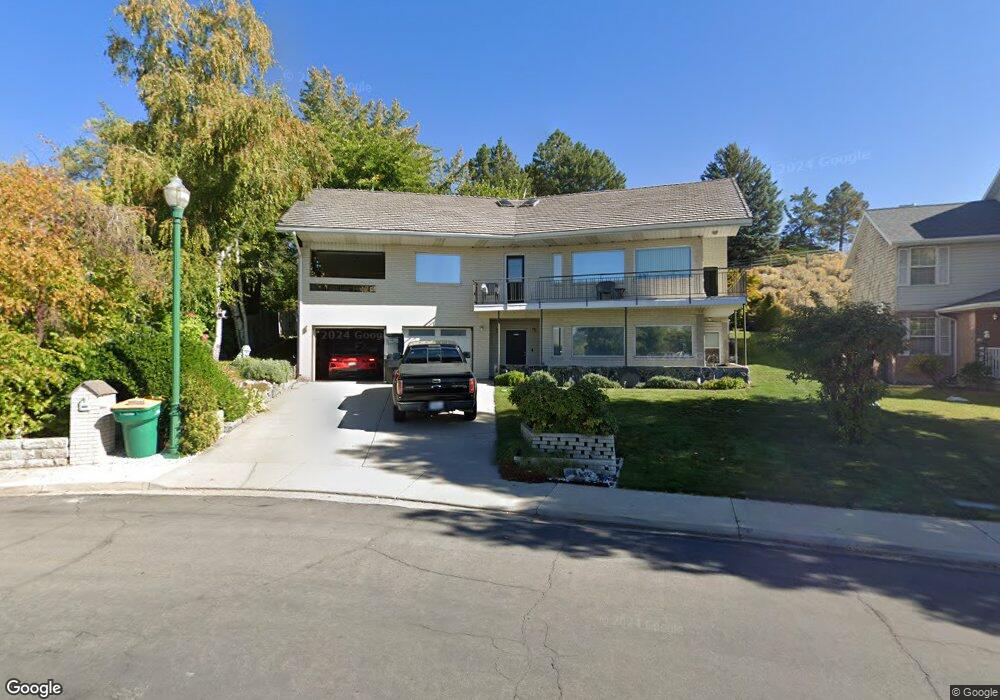
1641 S 350 W Orem, UT 84058
Lakeview NeighborhoodEstimated Value: $621,000 - $643,851
4
Beds
3
Baths
3,910
Sq Ft
$162/Sq Ft
Est. Value
About This Home
This home is located at 1641 S 350 W, Orem, UT 84058 and is currently estimated at $634,950, approximately $162 per square foot. 1641 S 350 W is a home located in Utah County with nearby schools including Cherry Hill Elementary School, Lakeridge Jr High School, and Mountain View High School.
Ownership History
Date
Name
Owned For
Owner Type
Purchase Details
Closed on
Sep 5, 2002
Sold by
Fisher David
Bought by
Masoud Baha
Current Estimated Value
Home Financials for this Owner
Home Financials are based on the most recent Mortgage that was taken out on this home.
Original Mortgage
$245,000
Interest Rate
6.24%
Mortgage Type
Seller Take Back
Purchase Details
Closed on
Aug 29, 2000
Sold by
Masoud Baha and Masoud Pam Bradford
Bought by
Fisher David
Home Financials for this Owner
Home Financials are based on the most recent Mortgage that was taken out on this home.
Original Mortgage
$245,200
Interest Rate
8.13%
Purchase Details
Closed on
Jan 14, 2000
Sold by
Lowe Richard Earl and Lowe Beverly Ann
Bought by
Masoud Baha and Masoud Pam Bradford
Home Financials for this Owner
Home Financials are based on the most recent Mortgage that was taken out on this home.
Original Mortgage
$225,400
Interest Rate
7.83%
Mortgage Type
Seller Take Back
Create a Home Valuation Report for This Property
The Home Valuation Report is an in-depth analysis detailing your home's value as well as a comparison with similar homes in the area
Home Values in the Area
Average Home Value in this Area
Purchase History
| Date | Buyer | Sale Price | Title Company |
|---|---|---|---|
| Masoud Baha | -- | -- | |
| Fisher David | -- | Inwest Title Services Inc | |
| Masoud Baha | -- | -- |
Source: Public Records
Mortgage History
| Date | Status | Borrower | Loan Amount |
|---|---|---|---|
| Closed | Masoud Baha | $245,000 | |
| Previous Owner | Fisher David | $245,200 | |
| Previous Owner | Masoud Baha | $225,400 |
Source: Public Records
Tax History
| Year | Tax Paid | Tax Assessment Tax Assessment Total Assessment is a certain percentage of the fair market value that is determined by local assessors to be the total taxable value of land and additions on the property. | Land | Improvement |
|---|---|---|---|---|
| 2025 | $2,615 | $352,000 | -- | -- |
| 2024 | $2,615 | $319,715 | $0 | $0 |
| 2023 | $2,396 | $314,875 | $0 | $0 |
| 2022 | $2,437 | $310,255 | $0 | $0 |
| 2021 | $2,270 | $437,800 | $185,500 | $252,300 |
| 2020 | $2,088 | $395,800 | $148,400 | $247,400 |
| 2019 | $2,008 | $395,800 | $148,400 | $247,400 |
| 2018 | $1,917 | $361,000 | $130,300 | $230,700 |
| 2017 | $1,857 | $187,330 | $0 | $0 |
| 2016 | $1,866 | $173,580 | $0 | $0 |
| 2015 | $1,756 | $154,495 | $0 | $0 |
| 2014 | $1,701 | $148,995 | $0 | $0 |
Source: Public Records
Map
Nearby Homes
- 355 W 1700 S
- 302 W Hidden Hollow Dr
- 467 W 1640 S
- 1776 S 320 W
- 458 W 1840 S
- 1710 S 165 W
- 1675 S Lakewood Dr
- 1445 S 430 W
- 1490 S 135 W
- 442 W 1430 S Unit 421
- 150 W Westview Dr
- 1755 S Main St
- 1680 S 50 E
- 1758 S 50 E
- 1874 S Main St
- 2068 S 140 W
- 108 W 2070 S
- 2939 W 1930 N
- 1700 S Sandhill Rd Unit F401
- 187 E 1780 S
Your Personal Tour Guide
Ask me questions while you tour the home.