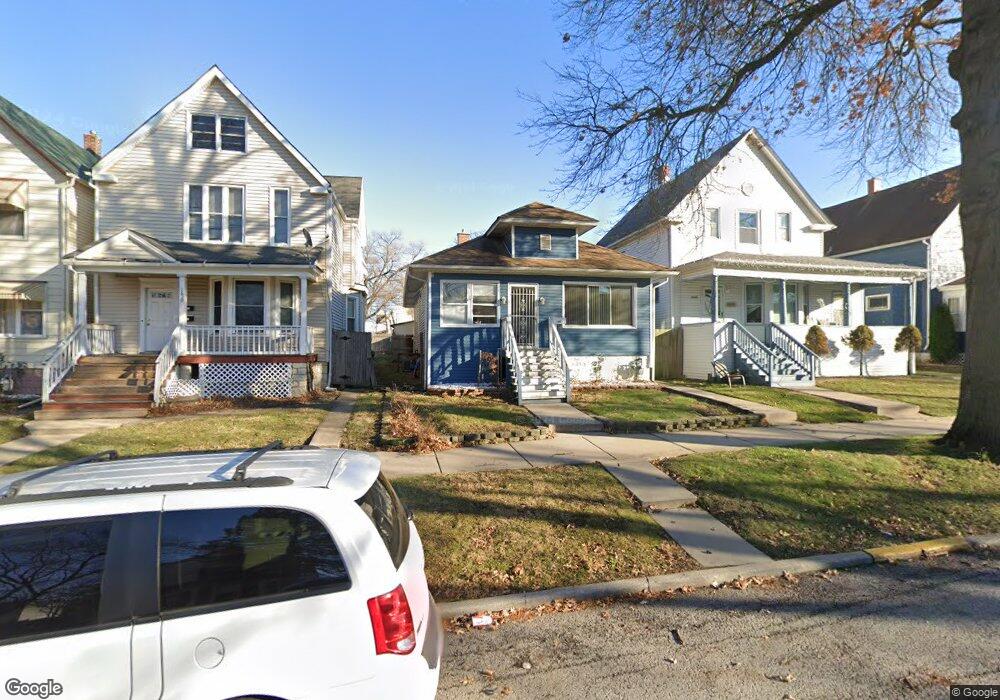
1641 Thorn St Chicago Heights, IL 60411
Roosevelt-Cook County NeighborhoodEstimated Value: $100,000 - $145,124
3
Beds
2
Baths
1,044
Sq Ft
$120/Sq Ft
Est. Value
About This Home
This home is located at 1641 Thorn St, Chicago Heights, IL 60411 and is currently estimated at $125,781, approximately $120 per square foot. 1641 Thorn St is a home located in Cook County with nearby schools including Washington-Mckinley Elementary School, Bloom High School, and St Agnes School.
Ownership History
Date
Name
Owned For
Owner Type
Purchase Details
Closed on
Sep 1, 2006
Sold by
Martinez Rafael
Bought by
Martinez Rafael and Guerrero Maria Martina
Current Estimated Value
Home Financials for this Owner
Home Financials are based on the most recent Mortgage that was taken out on this home.
Original Mortgage
$72,100
Interest Rate
6.54%
Mortgage Type
New Conventional
Purchase Details
Closed on
Dec 19, 2001
Sold by
Pacheco Joe Anthony
Bought by
Martinez Rafael
Home Financials for this Owner
Home Financials are based on the most recent Mortgage that was taken out on this home.
Original Mortgage
$74,250
Interest Rate
6.53%
Mortgage Type
FHA
Purchase Details
Closed on
Jul 19, 2000
Sold by
Juarez Julio Pacheco and Pacheco Joe Anthony
Bought by
Pacheco Joe Anthony
Purchase Details
Closed on
Nov 20, 1996
Sold by
Pacheco Juarez Julio P and Pacheco Juarez Julio
Bought by
Pacheco Juarez Julio P and Pacheco Juarez Julio
Create a Home Valuation Report for This Property
The Home Valuation Report is an in-depth analysis detailing your home's value as well as a comparison with similar homes in the area
Home Values in the Area
Average Home Value in this Area
Purchase History
| Date | Buyer | Sale Price | Title Company |
|---|---|---|---|
| Martinez Rafael | -- | Lsi | |
| Martinez Rafael | $75,000 | -- | |
| Pacheco Joe Anthony | -- | -- | |
| Pacheco Juarez Julio P | -- | -- |
Source: Public Records
Mortgage History
| Date | Status | Borrower | Loan Amount |
|---|---|---|---|
| Closed | Martinez Rafael | $72,100 | |
| Closed | Martinez Rafael | $74,250 |
Source: Public Records
Tax History Compared to Growth
Tax History
| Year | Tax Paid | Tax Assessment Tax Assessment Total Assessment is a certain percentage of the fair market value that is determined by local assessors to be the total taxable value of land and additions on the property. | Land | Improvement |
|---|---|---|---|---|
| 2024 | $2,007 | $7,091 | $1,453 | $5,638 |
| 2023 | $655 | $7,091 | $1,453 | $5,638 |
| 2022 | $655 | $4,457 | $1,259 | $3,198 |
| 2021 | $684 | $4,457 | $1,259 | $3,198 |
| 2020 | $796 | $4,457 | $1,259 | $3,198 |
| 2019 | $907 | $5,004 | $1,162 | $3,842 |
| 2018 | $1,659 | $6,466 | $1,162 | $5,304 |
| 2017 | $1,618 | $6,466 | $1,162 | $5,304 |
| 2016 | $1,937 | $6,109 | $1,065 | $5,044 |
| 2015 | $1,848 | $6,109 | $1,065 | $5,044 |
| 2014 | $1,860 | $6,109 | $1,065 | $5,044 |
| 2013 | $2,099 | $6,778 | $1,065 | $5,713 |
Source: Public Records
Map
Nearby Homes
- 1636 Euclid Ave
- 63 Hickory St
- 1631 Buena Vista Ave
- 1657 School St
- 1667 Buena Vista Ave
- 25 E 16th St
- 1632 Oak St
- 81 W 15th St
- 83 W 15th St
- 150 Hickory St
- 636 Chicago Rd
- 50 W 14th Place
- 1606 Edgewood Ave
- 66 W 14th Place
- 72 W 19th St
- 1912 Euclid Ave
- 195 W 15th St
- 215 W 16th St
- 21 W 21st St
- 251 Hickory St
- 1639 Thorn St Unit 2
- 1639 Thorn St Unit 1
- 1645 Thorn St
- 1647 Thorn St
- 1651 Thorn St
- 1633 Thorn St
- 1640 Aberdeen St
- 1642 Aberdeen St
- 1634 Aberdeen St
- 1646 Aberdeen St
- 1653 Thorn St
- 1650 Aberdeen St
- 1630 Aberdeen St
- 1642 Thorn St
- 1638 Thorn St
- 1646 Thorn St
- 1636 Thorn St
- 1652 Aberdeen St
- 1648 Thorn St
- 1656 Aberdeen St