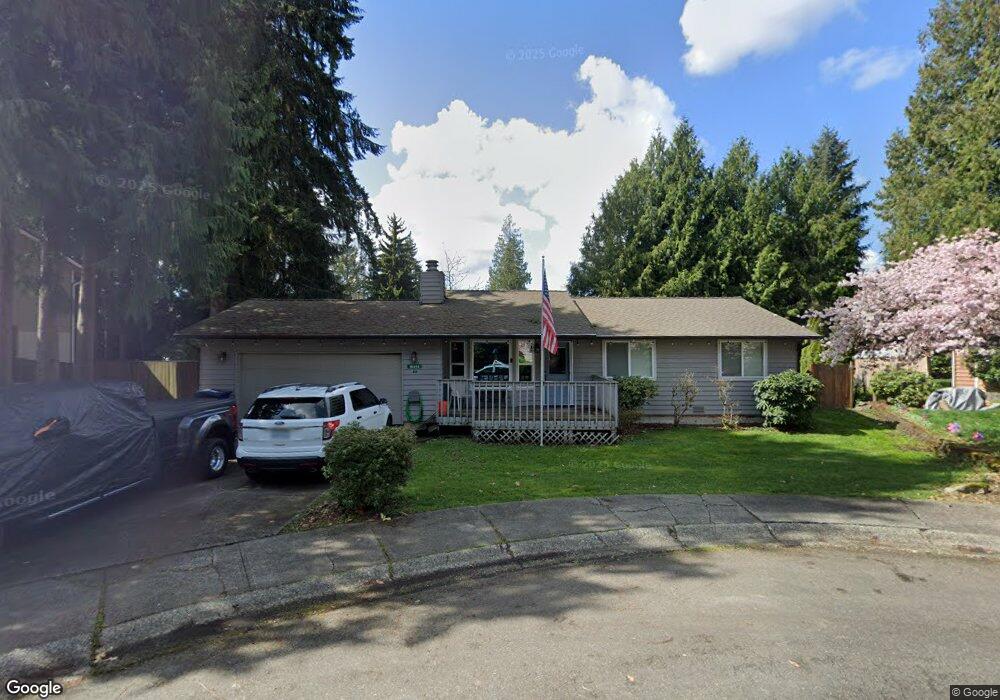
16414 29th Dr SE Bothell, WA 98012
Estimated Value: $747,000 - $866,000
3
Beds
1
Bath
1,075
Sq Ft
$744/Sq Ft
Est. Value
About This Home
This home is located at 16414 29th Dr SE, Bothell, WA 98012 and is currently estimated at $800,109, approximately $744 per square foot. 16414 29th Dr SE is a home located in Snohomish County with nearby schools including Cedar Wood Elementary School, Heatherwood Middle School, and Henry M. Jackson High School.
Ownership History
Date
Name
Owned For
Owner Type
Purchase Details
Closed on
Jul 16, 2014
Sold by
Munro Fanning Heather N
Bought by
Fanning Lee G
Current Estimated Value
Purchase Details
Closed on
Apr 2, 2008
Sold by
Fanning Lee
Bought by
Fanning Lee and Munro Fanning Heather N
Home Financials for this Owner
Home Financials are based on the most recent Mortgage that was taken out on this home.
Original Mortgage
$242,000
Interest Rate
5.99%
Mortgage Type
Purchase Money Mortgage
Purchase Details
Closed on
Apr 13, 2004
Sold by
Bailey Mark W and Bailey Lisa I
Bought by
Fanning Lee G
Home Financials for this Owner
Home Financials are based on the most recent Mortgage that was taken out on this home.
Original Mortgage
$179,200
Interest Rate
3.87%
Mortgage Type
Purchase Money Mortgage
Create a Home Valuation Report for This Property
The Home Valuation Report is an in-depth analysis detailing your home's value as well as a comparison with similar homes in the area
Home Values in the Area
Average Home Value in this Area
Purchase History
| Date | Buyer | Sale Price | Title Company |
|---|---|---|---|
| Fanning Lee G | -- | None Available | |
| Fanning Lee | $56,573 | First American Title Ins Co | |
| Fanning Lee G | $224,000 | Stewart |
Source: Public Records
Mortgage History
| Date | Status | Borrower | Loan Amount |
|---|---|---|---|
| Previous Owner | Fanning Lee | $242,000 | |
| Previous Owner | Fanning Lee G | $179,200 | |
| Closed | Fanning Lee G | $33,600 |
Source: Public Records
Tax History
| Year | Tax Paid | Tax Assessment Tax Assessment Total Assessment is a certain percentage of the fair market value that is determined by local assessors to be the total taxable value of land and additions on the property. | Land | Improvement |
|---|---|---|---|---|
| 2026 | $6,533 | $720,900 | $530,000 | $190,900 |
| 2025 | $6,074 | $674,100 | $495,000 | $179,100 |
| 2024 | $6,074 | $629,100 | $450,000 | $179,100 |
| 2023 | $6,423 | $730,100 | $525,000 | $205,100 |
| 2022 | $5,424 | $532,900 | $359,000 | $173,900 |
| 2020 | $5,327 | $440,100 | $287,000 | $153,100 |
| 2019 | $4,956 | $410,400 | $260,000 | $150,400 |
| 2018 | $4,762 | $359,100 | $225,000 | $134,100 |
| 2017 | $4,106 | $311,100 | $187,000 | $124,100 |
| 2016 | $3,547 | $281,700 | $164,000 | $117,700 |
| 2015 | $3,539 | $266,500 | $160,000 | $106,500 |
| 2013 | $3,140 | $208,800 | $120,000 | $88,800 |
Source: Public Records
Map
Nearby Homes
- 2502 166th Place SE
- 17715 2nd Ave W
- 16116 35th Park SE
- 16606 35th Ave SE Unit 9A
- 17001 31st Dr SE
- 3620 159th Place SE
- 16519 37th Dr SE
- 2127 159th Ct SE
- 17116 35th Dr SE Unit C6
- 17116 35th Dr SE Unit C2
- 17116 35th Dr SE Unit A2
- 15502 25th Ln SE
- 3701 170th Place SE
- 5 xx 158th St SE
- 3621 156th Place SE
- 1831 Mill Fern Dr SE Unit 322
- 4003 168th Place SE
- 2821 152nd Place SE
- 1800 Mill Creek Rd Unit 8B
- 1800 Mill Creek Rd Unit 56A
- 16422 29th Dr SE
- 16410 29th Dr SE
- 16413 28th Dr SE
- 16419 28th Dr SE
- 16409 29th Dr SE
- 16405 28th Dr SE
- 16430 29th Dr SE
- 16427 28th Dr SE
- 16415 29th Dr SE
- 16423 29th Dr SE
- 16411 29th Dr SE
- 2905 165th Place SE
- 2831 165th Place SE
- 16326 29th Ct SE
- 16431 29th Dr SE
- 2816 164th Place SE
- 2825 165th Place SE
- 2815 164th Place SE
- 16327 29th Ct SE
- 3006 164th Place SE
Your Personal Tour Guide
Ask me questions while you tour the home.