16414 Crescent Lake Dr Crest Hill, IL 60403
Estimated Value: $260,871 - $277,000
2
Beds
2
Baths
1,263
Sq Ft
$213/Sq Ft
Est. Value
About This Home
This home is located at 16414 Crescent Lake Dr, Crest Hill, IL 60403 and is currently estimated at $268,468, approximately $212 per square foot. 16414 Crescent Lake Dr is a home located in Will County with nearby schools including Richland Elementary School, Richland Jr High School, and Lockport Township High School East.
Ownership History
Date
Name
Owned For
Owner Type
Purchase Details
Closed on
Apr 2, 2018
Sold by
Purcell Patricia A and Purcell Michael W
Bought by
Michael W Purcell and Michael Patricia A Purcell
Current Estimated Value
Purchase Details
Closed on
Aug 24, 2017
Sold by
Thornton Andrew and Estate Of Betty Ann Thorton
Bought by
Purcell Michael W and Purcell Patricia A
Purchase Details
Closed on
Feb 24, 2017
Sold by
Tucker Linda and Mcguire Sandra
Bought by
Thornton Betty Ann
Home Financials for this Owner
Home Financials are based on the most recent Mortgage that was taken out on this home.
Original Mortgage
$131,100
Interest Rate
4.09%
Mortgage Type
New Conventional
Purchase Details
Closed on
Oct 31, 2005
Sold by
Drh Cambridge Homes Inc
Bought by
Patlan Adelaido H
Create a Home Valuation Report for This Property
The Home Valuation Report is an in-depth analysis detailing your home's value as well as a comparison with similar homes in the area
Home Values in the Area
Average Home Value in this Area
Purchase History
| Date | Buyer | Sale Price | Title Company |
|---|---|---|---|
| Michael W Purcell | -- | Attorney | |
| Purcell Michael W | $171,000 | Carrington Title Partners Ll | |
| Thornton Betty Ann | $138,000 | Attorney | |
| Patlan Adelaido H | $188,000 | First American |
Source: Public Records
Mortgage History
| Date | Status | Borrower | Loan Amount |
|---|---|---|---|
| Previous Owner | Thornton Betty Ann | $131,100 |
Source: Public Records
Tax History Compared to Growth
Tax History
| Year | Tax Paid | Tax Assessment Tax Assessment Total Assessment is a certain percentage of the fair market value that is determined by local assessors to be the total taxable value of land and additions on the property. | Land | Improvement |
|---|---|---|---|---|
| 2024 | $5,184 | $80,215 | $20,537 | $59,678 |
| 2023 | $5,184 | $72,013 | $18,437 | $53,576 |
| 2022 | $4,868 | $67,840 | $17,369 | $50,471 |
| 2021 | $4,575 | $63,754 | $16,323 | $47,431 |
| 2020 | $4,432 | $61,657 | $15,786 | $45,871 |
| 2019 | $4,164 | $58,443 | $14,963 | $43,480 |
| 2018 | $3,838 | $53,498 | $13,697 | $39,801 |
| 2017 | $3,595 | $50,503 | $12,930 | $37,573 |
| 2016 | $2,908 | $47,332 | $12,118 | $35,214 |
| 2015 | $3,278 | $43,303 | $11,087 | $32,216 |
| 2014 | $3,278 | $42,042 | $10,764 | $31,278 |
| 2013 | $3,278 | $45,290 | $11,097 | $34,193 |
Source: Public Records
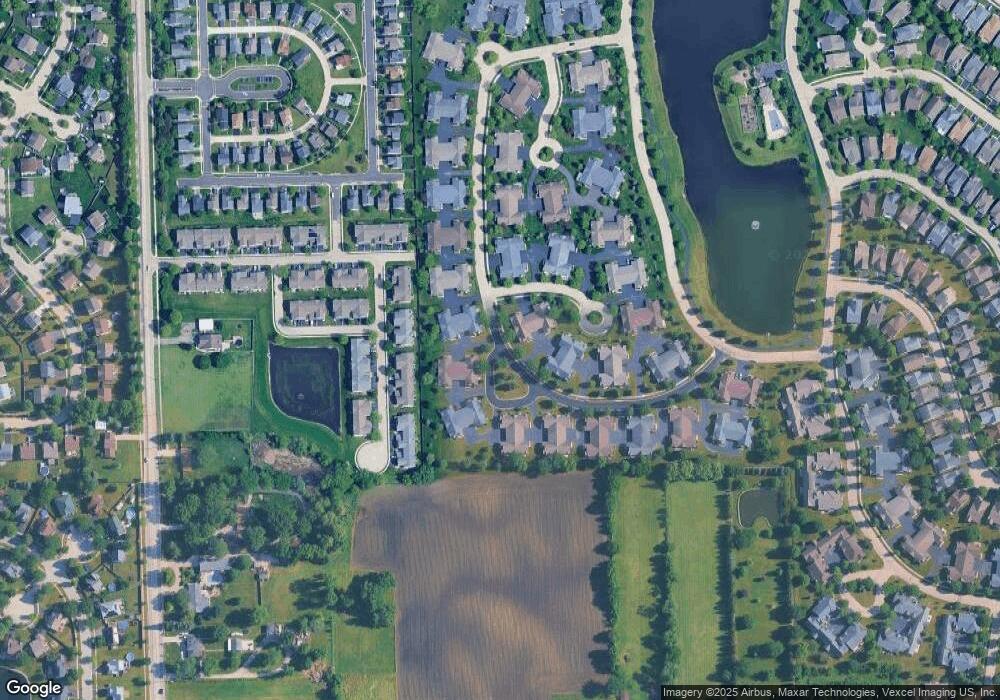
Map
Nearby Homes
- 16400 Crescent Lake Dr
- 16416 Crescent Lake Ct
- 21543 Eich Dr
- 21533 Cormorant St
- 21316 Brush Lake Dr
- 21308 Brush Lake Dr
- 3511 Sumac Dr
- 21522 Lake st Clair Dr
- 21201 Lily Lake Ln
- 21531 Wolf Lake Way
- 16400 Grandwood Lake Dr
- 3714 Harms Rd
- 16415 Grandwood Lake Dr
- 16613 Buckner Pond Way
- 16163 Seneca Lake Cir
- 21546 Victory Lake Way Unit 8
- 16012 Carillon Lakes Ct
- 2408 Chestnut St
- 3753 Indian Head Ln Unit 1
- 733 S Mecosta Ln Unit 2
- 16410 Crescent Lake Dr
- 16404 Crescent Lake Dr
- 16412 Crescent Lake Ct
- 16412 Crescent Lake Ct Unit A
- 16408 Crescent Lake Dr
- 16406 Crescent Lake Dr Unit 6
- 16421 Crescent Lake Dr
- 16402 Crescent Lake Dr
- 21429 Timber Lake Ct
- 16414 Crescent Lake Ct
- 16418 Crescent Lake Ct
- 16423 Crescent Lake Dr
- 16427 Crescent Lake Dr
- 21427 Timber Lake Ct
- 16426 Crescent Lake Ct
- 16370 Crescent Lake Dr
- 16370 Crescent Lake Dr Unit 6370
- 16370 Crescent Lake Dr Unit 163
- 16425 Crescent Lake Dr Unit 6