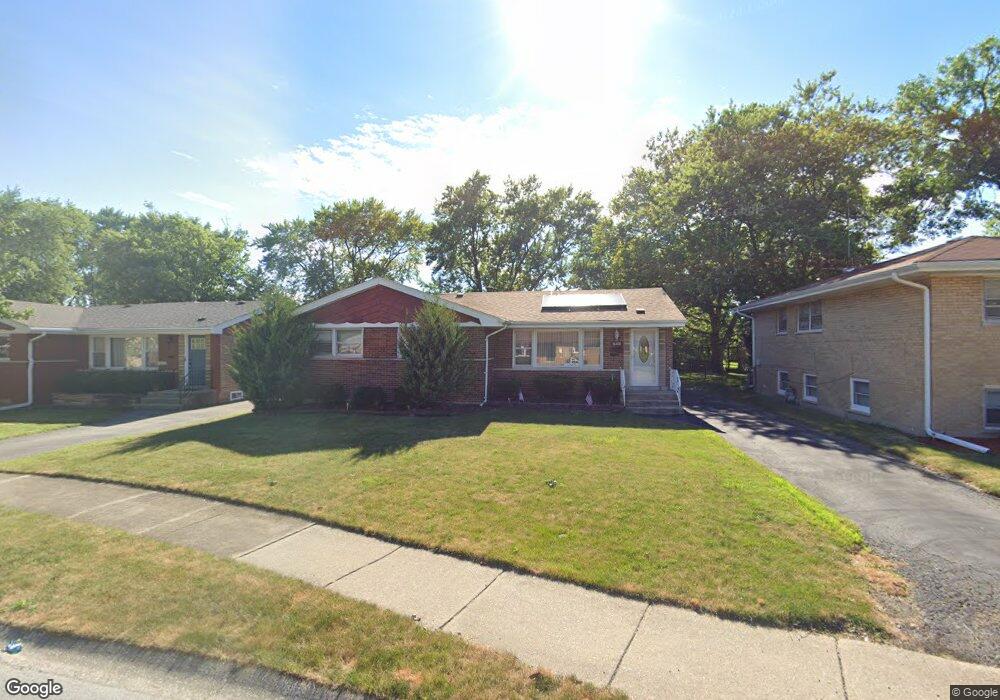
16418 Dobson Ave South Holland, IL 60473
Central District NeighborhoodEstimated Value: $217,000 - $261,000
3
Beds
2
Baths
1,329
Sq Ft
$183/Sq Ft
Est. Value
About This Home
This home is located at 16418 Dobson Ave, South Holland, IL 60473 and is currently estimated at $243,252, approximately $183 per square foot. 16418 Dobson Ave is a home located in Cook County with nearby schools including Greenwood Elementary School, Mckinley Elementary School, and Mckinley Jr High School.
Ownership History
Date
Name
Owned For
Owner Type
Purchase Details
Closed on
Feb 23, 1998
Sold by
Louden Derrick J
Bought by
Thompson Melvin R and Thompson Mary H
Current Estimated Value
Purchase Details
Closed on
Jan 10, 1997
Sold by
Costantino Esther V
Bought by
Thompson Melvin R and Thompson Mary H
Home Financials for this Owner
Home Financials are based on the most recent Mortgage that was taken out on this home.
Original Mortgage
$98,150
Interest Rate
7.81%
Create a Home Valuation Report for This Property
The Home Valuation Report is an in-depth analysis detailing your home's value as well as a comparison with similar homes in the area
Home Values in the Area
Average Home Value in this Area
Purchase History
| Date | Buyer | Sale Price | Title Company |
|---|---|---|---|
| Thompson Melvin R | -- | -- | |
| Thompson Melvin R | -- | -- | |
| Thompson Melvin R | $120,000 | -- |
Source: Public Records
Mortgage History
| Date | Status | Borrower | Loan Amount |
|---|---|---|---|
| Previous Owner | Thompson Melvin R | $98,150 |
Source: Public Records
Tax History Compared to Growth
Tax History
| Year | Tax Paid | Tax Assessment Tax Assessment Total Assessment is a certain percentage of the fair market value that is determined by local assessors to be the total taxable value of land and additions on the property. | Land | Improvement |
|---|---|---|---|---|
| 2024 | $8,291 | $24,001 | $4,337 | $19,664 |
| 2023 | $1,864 | $24,001 | $4,337 | $19,664 |
| 2022 | $1,864 | $11,912 | $3,717 | $8,195 |
| 2021 | $3,354 | $11,912 | $3,717 | $8,195 |
| 2020 | $1,531 | $11,912 | $3,717 | $8,195 |
| 2019 | $3,366 | $12,338 | $3,304 | $9,034 |
| 2018 | $1,943 | $12,338 | $3,304 | $9,034 |
| 2017 | $1,866 | $12,338 | $3,304 | $9,034 |
| 2016 | $2,698 | $9,715 | $3,097 | $6,618 |
| 2015 | $5,685 | $11,832 | $3,097 | $8,735 |
| 2014 | $3,481 | $11,832 | $3,097 | $8,735 |
| 2013 | $2,737 | $11,589 | $3,097 | $8,492 |
Source: Public Records
Map
Nearby Homes
- 16348 Dobson Ave
- 943 E 164th Ct
- 16347 Ingleside Ave
- 16327 Dobson Ave
- 944 E 163rd Place
- 16410 University Ave
- 16400 University Ave
- 1006 E 163rd St
- 16265 Drexel Ave
- 913 E 162nd Place
- 1012 E 162nd Place
- 16560 Greenwood Ave
- 16314 Woodlawn Ave E
- 16465 Woodlawn East Ave
- 907 E 162nd Place
- 16639 Dobson Ave
- 16315 Kenwood Ave
- 16656 Woodlawn East Ct
- 930 E 161st Place
- 1238 E 166th St
- 16406 Dobson Ave
- 16422 Dobson Ave
- 962 E 164th Ct
- 16354 Dobson Ave
- 16430 Dobson Ave
- 963 E 164th Ct
- 16352 Dobson Ave
- 16438 Dobson Ave
- 965 E 163rd Place
- 954 E 164th Ct
- 16415 Dobson Ave
- 16423 Dobson Ave
- 1005 E 163rd Place
- 16407 Dobson Ave
- 16431 Dobson Ave
- 16351 Dobson Ave
- 16446 Dobson Ave
- 1005 Ellis Ct
- 961 E 163rd Place
- 957 E 164th Ct