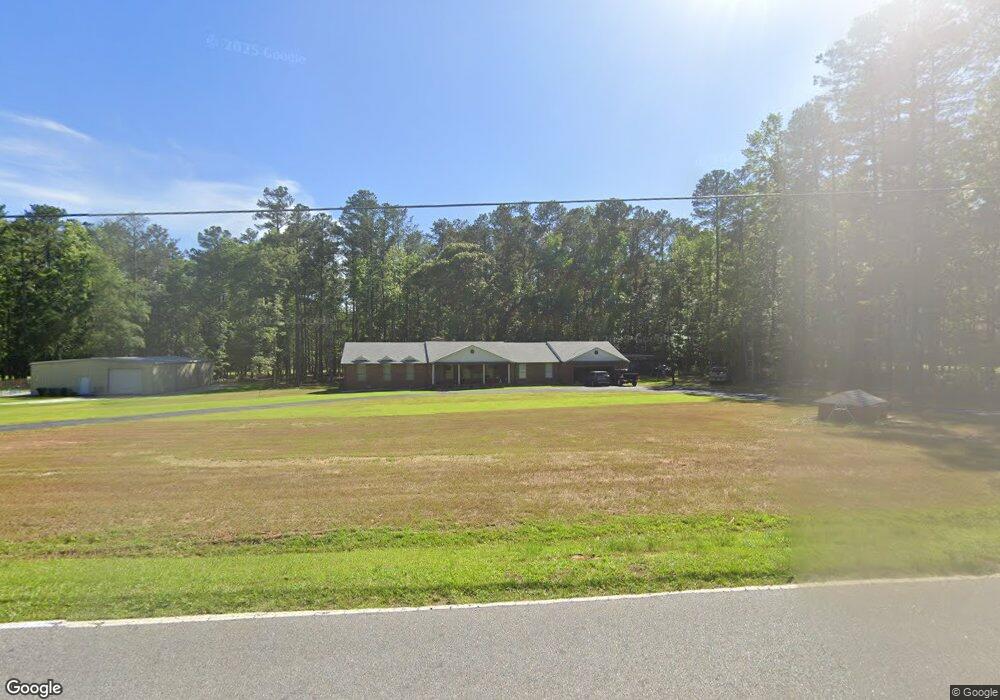
1642 Reese Rd Sharpsburg, GA 30277
Estimated Value: $444,000 - $493,000
3
Beds
3
Baths
2,579
Sq Ft
$181/Sq Ft
Est. Value
About This Home
This home is located at 1642 Reese Rd, Sharpsburg, GA 30277 and is currently estimated at $466,884, approximately $181 per square foot. 1642 Reese Rd is a home located in Coweta County with nearby schools including Willis Road Elementary School, Lee Middle School, and East Coweta High School.
Ownership History
Date
Name
Owned For
Owner Type
Purchase Details
Closed on
Jan 15, 2021
Sold by
Drake Thomas B
Bought by
Moss Adam Paul and Moss Lindsey
Current Estimated Value
Home Financials for this Owner
Home Financials are based on the most recent Mortgage that was taken out on this home.
Original Mortgage
$294,224
Outstanding Balance
$261,806
Interest Rate
2.67%
Mortgage Type
VA
Estimated Equity
$205,078
Purchase Details
Closed on
Apr 3, 2012
Sold by
Drake Patricia S
Bought by
Drake Thomas B
Purchase Details
Closed on
Apr 23, 2001
Sold by
Hughes Robert O and Hughes Adele H
Bought by
Drake Thomas B and Drake Particia S
Home Financials for this Owner
Home Financials are based on the most recent Mortgage that was taken out on this home.
Original Mortgage
$114,000
Interest Rate
6.9%
Mortgage Type
New Conventional
Purchase Details
Closed on
Aug 31, 2000
Sold by
Hughes Robert O & Ad
Bought by
Hughes Robert O
Purchase Details
Closed on
Sep 30, 1987
Bought by
Hughes Robert O & Ad
Create a Home Valuation Report for This Property
The Home Valuation Report is an in-depth analysis detailing your home's value as well as a comparison with similar homes in the area
Home Values in the Area
Average Home Value in this Area
Purchase History
| Date | Buyer | Sale Price | Title Company |
|---|---|---|---|
| Moss Adam Paul | $284,000 | -- | |
| Drake Thomas B | -- | -- | |
| Drake Thomas B | $161,000 | -- | |
| Hughes Robert O | -- | -- | |
| Hughes Robert O & Ad | -- | -- |
Source: Public Records
Mortgage History
| Date | Status | Borrower | Loan Amount |
|---|---|---|---|
| Open | Moss Adam Paul | $294,224 | |
| Previous Owner | Drake Thomas B | $114,000 |
Source: Public Records
Tax History Compared to Growth
Tax History
| Year | Tax Paid | Tax Assessment Tax Assessment Total Assessment is a certain percentage of the fair market value that is determined by local assessors to be the total taxable value of land and additions on the property. | Land | Improvement |
|---|---|---|---|---|
| 2025 | $4,450 | $188,338 | $27,881 | $160,457 |
| 2024 | $4,221 | $181,820 | $26,057 | $155,762 |
| 2023 | $4,221 | $149,288 | $24,127 | $125,161 |
| 2022 | $2,798 | $142,846 | $22,978 | $119,868 |
| 2021 | $1,729 | $124,378 | $22,978 | $101,400 |
| 2020 | $1,715 | $123,630 | $22,978 | $100,652 |
| 2019 | $1,051 | $77,555 | $17,862 | $59,692 |
| 2018 | $1,056 | $77,555 | $17,862 | $59,692 |
| 2017 | $1,427 | $77,555 | $17,862 | $59,693 |
| 2016 | $1,403 | $77,555 | $17,862 | $59,692 |
| 2015 | $1,366 | $77,555 | $17,862 | $59,692 |
| 2014 | $1,345 | $77,555 | $17,862 | $59,692 |
Source: Public Records
Map
Nearby Homes
- 50 Kay Ct
- 8 Chiefs Trail
- 7483 Highway 54
- 40 Long Branch Trail
- 51 Christopher Rd
- 73 Oakhurst Trail
- 127 Circle H Rd
- Grayson with Basement Plan at Twelve Parks - Ranch
- Denton with Basement Plan at Twelve Parks - Ranch
- Sullivan Plan at Twelve Parks - Ranch
- Denton Plan at Twelve Parks - Ranch
- Grayson Plan at Twelve Parks - Ranch
- 474 Marcella Ave
- 24 Tallulah Trail
- 21 Lake Park Ct
- 28 Fawn Ct
- Briarwood Plan at Twelve Parks 55+
- Sullivan Plan at Twelve Parks 55+
- 4 Unicoi Trail
- 12 Unicoi Trail