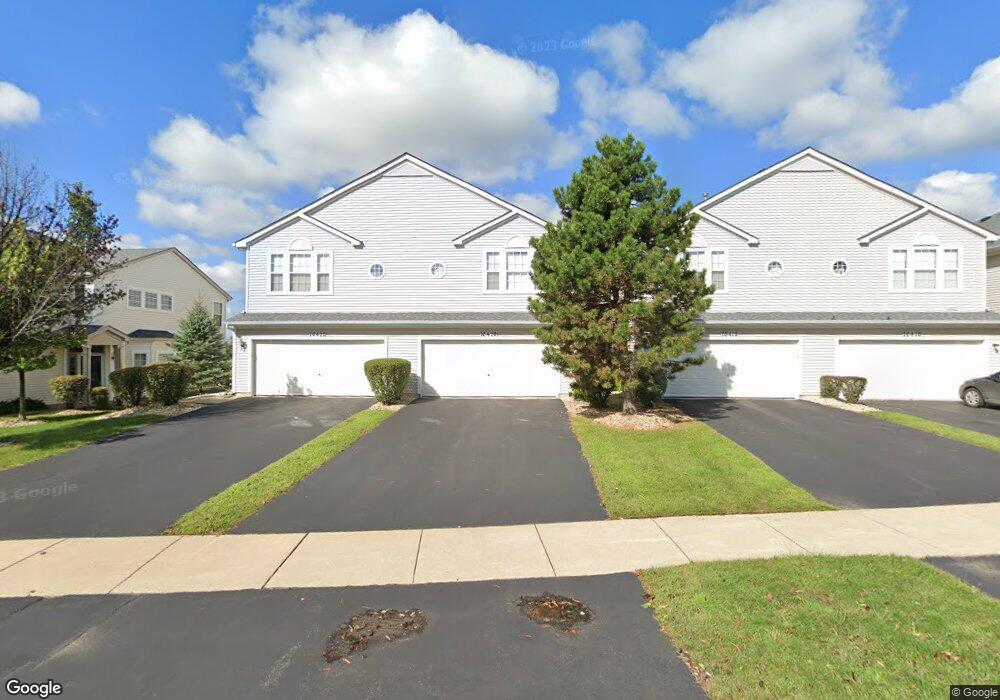
16420 Newcastle Way Unit T1802 Lockport, IL 60441
South Homer Glen NeighborhoodEstimated Value: $292,973 - $316,000
2
Beds
3
Baths
1,665
Sq Ft
$185/Sq Ft
Est. Value
About This Home
This home is located at 16420 Newcastle Way Unit T1802, Lockport, IL 60441 and is currently estimated at $308,243, approximately $185 per square foot. 16420 Newcastle Way Unit T1802 is a home located in Will County with nearby schools including William E Young School, Hadley Middle School, and Homer Jr High School.
Ownership History
Date
Name
Owned For
Owner Type
Purchase Details
Closed on
Jul 30, 2007
Sold by
Lambert Jamie
Bought by
Hlavin Paula L
Current Estimated Value
Home Financials for this Owner
Home Financials are based on the most recent Mortgage that was taken out on this home.
Original Mortgage
$185,270
Outstanding Balance
$117,723
Interest Rate
6.73%
Mortgage Type
Purchase Money Mortgage
Estimated Equity
$190,520
Purchase Details
Closed on
Mar 8, 2007
Sold by
Lambert Kevin and Lambert Jaime
Bought by
Lambert Jamie
Purchase Details
Closed on
Sep 17, 2002
Sold by
Montalbano Builders Inc
Bought by
Lambert Kevin and Fischer Jamie
Home Financials for this Owner
Home Financials are based on the most recent Mortgage that was taken out on this home.
Original Mortgage
$144,000
Interest Rate
6.4%
Create a Home Valuation Report for This Property
The Home Valuation Report is an in-depth analysis detailing your home's value as well as a comparison with similar homes in the area
Home Values in the Area
Average Home Value in this Area
Purchase History
| Date | Buyer | Sale Price | Title Company |
|---|---|---|---|
| Hlavin Paula L | $191,000 | Multiple | |
| Lambert Jamie | -- | Chicago Title Insurance Co | |
| Lambert Kevin | $154,000 | First American Title |
Source: Public Records
Mortgage History
| Date | Status | Borrower | Loan Amount |
|---|---|---|---|
| Open | Hlavin Paula L | $185,270 | |
| Previous Owner | Lambert Kevin | $144,000 |
Source: Public Records
Tax History Compared to Growth
Tax History
| Year | Tax Paid | Tax Assessment Tax Assessment Total Assessment is a certain percentage of the fair market value that is determined by local assessors to be the total taxable value of land and additions on the property. | Land | Improvement |
|---|---|---|---|---|
| 2024 | $5,783 | $74,410 | $12,038 | $62,372 |
| 2023 | $5,783 | $67,449 | $10,912 | $56,537 |
| 2022 | $5,334 | $62,978 | $10,189 | $52,789 |
| 2021 | $5,077 | $59,666 | $9,653 | $50,013 |
| 2020 | $5,045 | $57,471 | $9,298 | $48,173 |
| 2019 | $4,886 | $55,287 | $8,945 | $46,342 |
| 2018 | $4,740 | $53,319 | $8,842 | $44,477 |
| 2017 | $4,649 | $51,826 | $8,594 | $43,232 |
| 2016 | $4,536 | $50,097 | $8,307 | $41,790 |
| 2015 | $4,304 | $48,216 | $7,995 | $40,221 |
| 2014 | $4,304 | $46,392 | $7,830 | $38,562 |
| 2013 | $4,304 | $46,392 | $7,830 | $38,562 |
Source: Public Records
Map
Nearby Homes
- 16601 S Windsor Ln Unit T1611
- 14443 Etchingham Dr
- 16663 S Windsor Ln Unit T1644
- 14414 W 167th St
- 15053 Sagebrush Ln Unit 1254
- 14549 W 159th St
- 16515 S Farmington Ln
- 15326 W Harvest Ln
- 16340 S Alberta Ct
- 16609 S Silo Bend Dr
- 16001 S Leach Dr Unit 3
- 16860 S Ivy Ln
- 0B W 159th St
- 16508 S Brook Ln
- 15100 W 159th St
- 14858 W Glen Crest Ln
- 1,2 W Rambling Rd
- 0 NW 159th Parker St Unit MRD12445910
- 16947 S Timber Dr
- 16604 Pine Hill Dr
- 16412 Newcastle Way Unit T1806
- 16416 Newcastle Way Unit 1804
- 16414 Newcastle Way Unit T1805
- 16418 Newcastle Way Unit T1803
- 16422 Newcastle Way Unit T1801
- 16412 Newcastle Way Unit 1
- 16414 Newcastle Way Unit 3
- 16400 Newcastle Way Unit T1815
- 16404 Newcastle Way Unit T1813
- 16402 Newcastle Way Unit T1814
- 16406 Newcastle Way Unit T1812
- 16408 Newcastle Way Unit T1811
- 16428 Newcastle Way Unit T1795
- 16436 Newcastle Way Unit T1791
- 16432 Newcastle Way Unit T1793
- 16426 Newcastle Way
- 16430 Newcastle Way
- 16434 Newcastle Way
- 16428 Newcastle Way Unit 5
- 16419 Newcastle Way Unit T1891