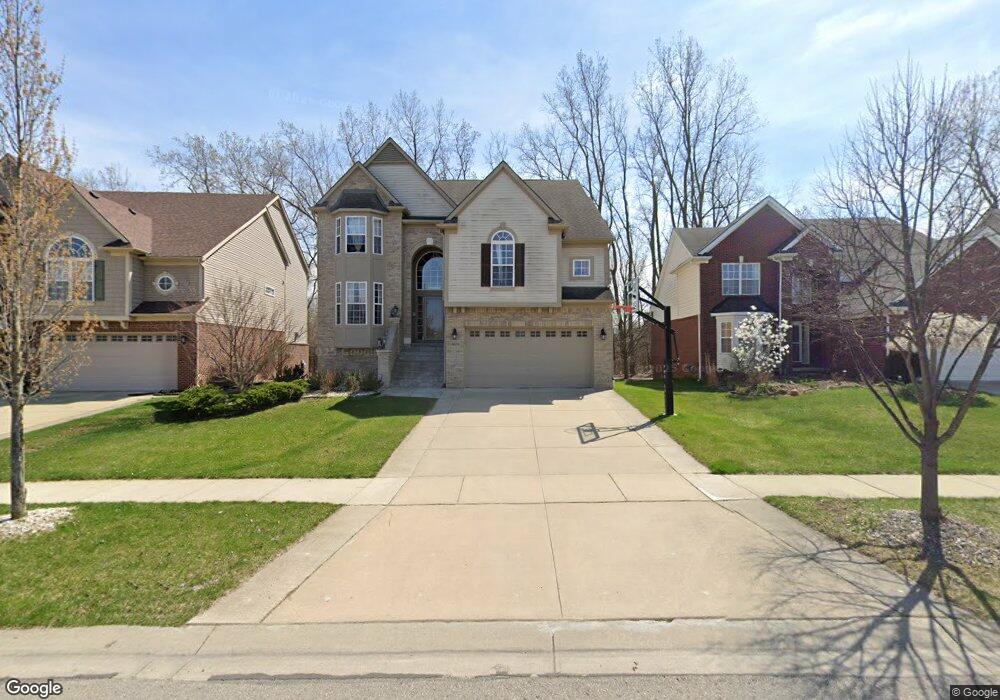
16424 Mulberry Way Unit 54 Northville, MI 48168
Estimated Value: $623,412 - $680,000
4
Beds
3
Baths
2,896
Sq Ft
$225/Sq Ft
Est. Value
About This Home
This home is located at 16424 Mulberry Way Unit 54, Northville, MI 48168 and is currently estimated at $651,853, approximately $225 per square foot. 16424 Mulberry Way Unit 54 is a home located in Wayne County with nearby schools including Ridge Wood Elementary School, Hillside Middle School, and Northville High School.
Ownership History
Date
Name
Owned For
Owner Type
Purchase Details
Closed on
Mar 8, 2021
Sold by
Misra Sandeep
Bought by
Misra Sandeep and Misra Kavita
Current Estimated Value
Home Financials for this Owner
Home Financials are based on the most recent Mortgage that was taken out on this home.
Original Mortgage
$123,400
Outstanding Balance
$47,757
Interest Rate
2.7%
Mortgage Type
New Conventional
Estimated Equity
$604,096
Purchase Details
Closed on
Nov 26, 2010
Sold by
Bolisetty Narasimba and Bolisetty Anuradha
Bought by
Misra Sandeep
Purchase Details
Closed on
Aug 4, 2010
Sold by
Bolisetty Anuradha and Bolisetty Narasimha
Bought by
Federal Home Loan Mortgage Corp
Purchase Details
Closed on
Dec 14, 2005
Sold by
Sc Rdige Homes Llc
Bought by
Bolisetty Narasimha
Purchase Details
Closed on
Feb 23, 2005
Sold by
Winnick Northville Ridge Llc
Bought by
Sc Ridge Homes Llc
Create a Home Valuation Report for This Property
The Home Valuation Report is an in-depth analysis detailing your home's value as well as a comparison with similar homes in the area
Home Values in the Area
Average Home Value in this Area
Purchase History
| Date | Buyer | Sale Price | Title Company |
|---|---|---|---|
| Misra Sandeep | -- | Crossroads Title | |
| Misra Sandeep | -- | Crossroads Title | |
| Misra Sandeep | $270,000 | None Available | |
| Federal Home Loan Mortgage Corp | $368,985 | None Available | |
| Bolisetty Narasimha | $399,760 | Greco | |
| Sc Ridge Homes Llc | -- | Greco |
Source: Public Records
Mortgage History
| Date | Status | Borrower | Loan Amount |
|---|---|---|---|
| Open | Misra Sandeep | $123,400 | |
| Closed | Misra Sandeep | $123,400 |
Source: Public Records
Tax History Compared to Growth
Tax History
| Year | Tax Paid | Tax Assessment Tax Assessment Total Assessment is a certain percentage of the fair market value that is determined by local assessors to be the total taxable value of land and additions on the property. | Land | Improvement |
|---|---|---|---|---|
| 2025 | $4,395 | $293,200 | $0 | $0 |
| 2024 | $4,395 | $281,500 | $0 | $0 |
| 2023 | $4,194 | $253,200 | $0 | $0 |
| 2022 | $6,647 | $221,500 | $0 | $0 |
| 2021 | $6,539 | $219,200 | $0 | $0 |
| 2020 | $6,527 | $222,300 | $0 | $0 |
| 2019 | $6,406 | $222,300 | $0 | $0 |
| 2018 | $3,640 | $216,000 | $0 | $0 |
| 2017 | $4,977 | $217,200 | $0 | $0 |
| 2016 | $5,951 | $216,700 | $0 | $0 |
| 2015 | $16,466 | $202,800 | $0 | $0 |
| 2013 | $15,952 | $169,500 | $0 | $0 |
| 2012 | $4,930 | $156,400 | $37,400 | $119,000 |
Source: Public Records
Map
Nearby Homes
- 16413 Mulberry Way Unit 137
- 50306 Cressnut Ct Unit 111
- 46755 Five Mile Rd
- 15970 Morningside Unit 207
- 15940 Morningside Unit 189
- 49486 Coldwater Ridge Dr
- 49482 Coldwater Ridge Dr
- 15943 Morningside Unit 179
- 49462 Coldwater Ridge Dr
- 49458 Coldwater Ridge Dr
- 19085 Chaumont Way
- 16897 Carriage Way Unit 2
- 16865 Carriage Way Unit 10
- 16706 Dover Dr Unit 71
- 16707 Carriage Way Unit 53
- 16701 Carriage Way Unit 56
- 16702 Dover Dr Unit 73
- 16784 Dover Dr Unit 94
- 49401 N Glacier Unit 57
- 49478 Coldwater Ridge Dr
- 16418 Mulberry Way Unit 55
- 16430 Mulberry Way Unit 53
- 16412 Mulberry Way Unit 56
- 16436 Mulberry Way Unit 52
- 16406 Mulberry Way Unit 57
- 16442 Mulberry Way Unit 51
- 16425 Mulberry Way Unit 138
- 16131 Westminister Dr Unit 139
- 16400 Mulberry Way Unit 58
- 16448 Mulberry Way Unit 50
- 16147 Westminister Dr Unit 140
- 16163 Westminister Dr
- 16407 Mulberry Way Unit 136
- 16179 Westminister Dr Unit 142
- 16195 Westminister Dr Unit 143
- 16401 Mulberry Way Unit 135
- 16394 Mulberry Way Unit 59
- 16388 Mulberry Way Unit 60
- 16130 Mulberry Way
- 16211 Westminister Dr Unit 144