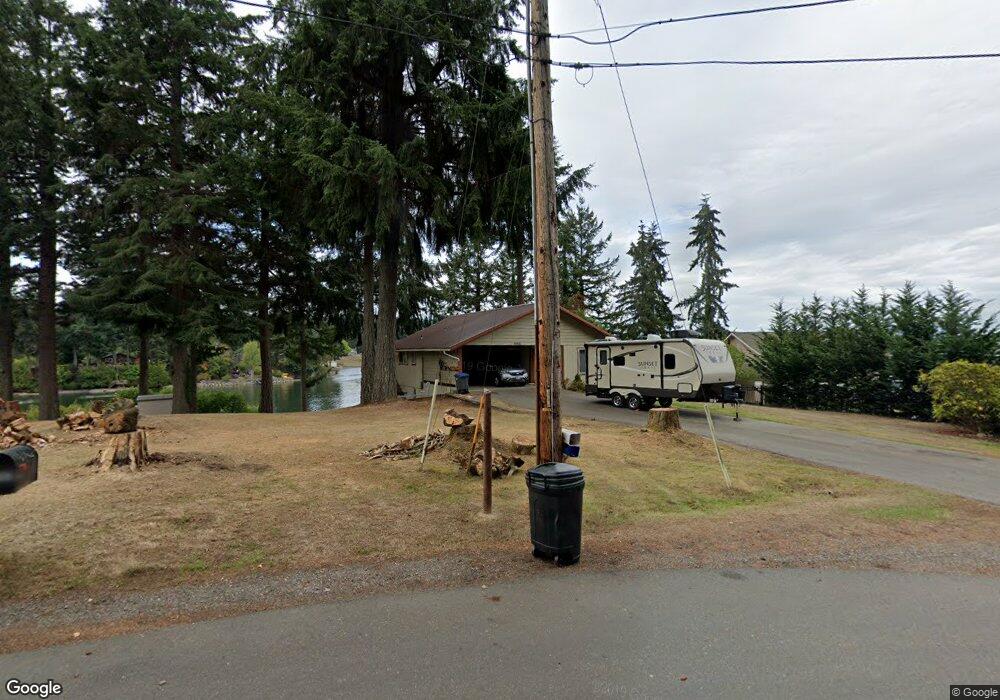
16425 Pearson Point Rd NE Poulsbo, WA 98370
Estimated Value: $759,000 - $990,971
1
Bed
2
Baths
962
Sq Ft
$936/Sq Ft
Est. Value
About This Home
This home is located at 16425 Pearson Point Rd NE, Poulsbo, WA 98370 and is currently estimated at $900,743, approximately $936 per square foot. 16425 Pearson Point Rd NE is a home located in Kitsap County with nearby schools including Hilder Pearson Elementary School, Poulsbo Middle School, and North Kitsap High School.
Ownership History
Date
Name
Owned For
Owner Type
Purchase Details
Closed on
Sep 23, 2024
Sold by
Krock Marc D
Bought by
Krock Holdings Llc
Current Estimated Value
Purchase Details
Closed on
Mar 25, 2021
Sold by
Pearson Point Family Llc
Bought by
Krock Marc D
Home Financials for this Owner
Home Financials are based on the most recent Mortgage that was taken out on this home.
Original Mortgage
$365,954
Interest Rate
2.8%
Mortgage Type
New Conventional
Purchase Details
Closed on
Nov 29, 2010
Sold by
Johnson Richard E and Marsh Barbara Jean
Bought by
Pearson Point Family Llc
Purchase Details
Closed on
Apr 23, 2010
Sold by
Estate Of Walter E Johnson and Johnson Kenneth
Bought by
Johnson Richard E and Marsh Barbara Jean
Purchase Details
Closed on
Jun 24, 2009
Sold by
Estate Of Betty Lee Johnson and Johnson Walter E
Bought by
Johnson Walter E
Create a Home Valuation Report for This Property
The Home Valuation Report is an in-depth analysis detailing your home's value as well as a comparison with similar homes in the area
Home Values in the Area
Average Home Value in this Area
Purchase History
| Date | Buyer | Sale Price | Title Company |
|---|---|---|---|
| Krock Holdings Llc | $313 | None Listed On Document | |
| Krock Marc D | $450,000 | Pacific Northwest Ttl Silver | |
| Pearson Point Family Llc | -- | None Available | |
| Johnson Richard E | -- | None Available | |
| Johnson Walter E | -- | None Available |
Source: Public Records
Mortgage History
| Date | Status | Borrower | Loan Amount |
|---|---|---|---|
| Previous Owner | Krock Marc D | $365,954 |
Source: Public Records
Tax History Compared to Growth
Tax History
| Year | Tax Paid | Tax Assessment Tax Assessment Total Assessment is a certain percentage of the fair market value that is determined by local assessors to be the total taxable value of land and additions on the property. | Land | Improvement |
|---|---|---|---|---|
| 2026 | $8,006 | $907,610 | $505,940 | $401,670 |
| 2025 | $8,006 | $907,610 | $505,940 | $401,670 |
| 2024 | $7,789 | $912,360 | $505,510 | $406,850 |
| 2023 | $6,839 | $786,020 | $458,490 | $327,530 |
| 2022 | $6,032 | $657,640 | $382,080 | $275,560 |
| 2021 | $5,790 | $583,460 | $337,990 | $245,470 |
| 2020 | $5,141 | $509,290 | $293,910 | $215,380 |
| 2019 | $5,150 | $509,290 | $293,910 | $215,380 |
| 2018 | $4,479 | $393,440 | $214,090 | $179,350 |
| 2017 | $4,465 | $393,440 | $214,090 | $179,350 |
| 2016 | $4,844 | $393,440 | $214,090 | $179,350 |
| 2015 | $4,587 | $374,770 | $214,090 | $160,680 |
| 2014 | -- | $348,830 | $214,090 | $134,740 |
| 2013 | -- | $348,830 | $214,090 | $134,740 |
Source: Public Records
Map
Nearby Homes
- 16460 Scandia Rd NW
- 15809 Virginia Point Rd NE
- 15739 Virginia Loop Rd NE
- 17198 Viking Way NW
- 16110 Cassie Place NW
- 11 Lot Cassie Place NW
- 16038 Cassie Place NW
- 0 XX Lemolo Shore Dr NE
- 1314 NE South Petterson Rd
- 17667 State Highway 305 NE
- 1678 NE Jacobson Rd
- 16214 Bay Ridge Dr NW
- 15485 NE Peterson Rd
- 17711 Viking Way NW
- 17680 Hallman Rd NW
- 16014 Bay Ridge Dr NW
- 1069 NW Luoto Ct
- 16778 Lemolo Shore Dr NE
- 18330 9th Ave NE
- 17008 Peterson Way NE
- 16501 Pearson Point Rd NE
- 16409 Pearson Point Rd NE
- 16555 Pearson Point Rd NE
- 16575 Pearson Point Rd NE
- 16385 Pearson Point Rd NE
- 16412 Pearson Point Rd NE
- 16479 Pearson Point Rd NE
- 16375 Pearson Point Rd NE
- 16377 Pearson Point Rd NE
- 16499 Pearson Point Rd NE
- 16488 Pearson Rd NE
- 16476 Pearson Rd NE
- 16333 Pearson Rd NE
- 16378 Pearson Point Rd NE
- 16371 Pearson Point Rd NE
- 16434 Pearson Rd NE
- 16392 Pearson Rd NE
- 16368 Pearson Rd NE
- 16227 Pearson Point Rd NE
- 16342 Pearson Rd NE