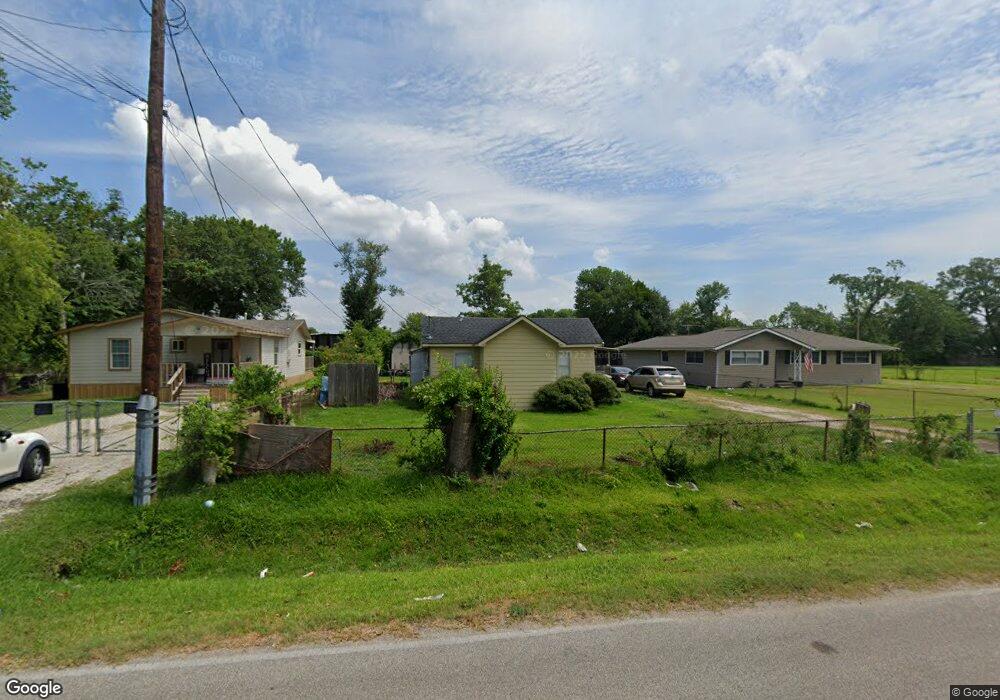
16425 Pecan St Channelview, TX 77530
Estimated Value: $143,000 - $195,000
2
Beds
1
Bath
1,036
Sq Ft
$164/Sq Ft
Est. Value
About This Home
This home is located at 16425 Pecan St, Channelview, TX 77530 and is currently estimated at $169,810, approximately $163 per square foot. 16425 Pecan St is a home located in Harris County with nearby schools including Channelview High School and Family Christian Academy.
Ownership History
Date
Name
Owned For
Owner Type
Purchase Details
Closed on
Aug 28, 2003
Sold by
Baker Thomas Dwayne and Baker Patricia Ann
Bought by
Montelongo Andres
Current Estimated Value
Home Financials for this Owner
Home Financials are based on the most recent Mortgage that was taken out on this home.
Original Mortgage
$56,810
Outstanding Balance
$25,682
Interest Rate
5.87%
Mortgage Type
Purchase Money Mortgage
Estimated Equity
$144,128
Purchase Details
Closed on
Aug 14, 2003
Sold by
Ramirez Michael A
Bought by
Baker Thomas Dwayne and Baker Patricia Ann
Home Financials for this Owner
Home Financials are based on the most recent Mortgage that was taken out on this home.
Original Mortgage
$56,810
Outstanding Balance
$25,682
Interest Rate
5.87%
Mortgage Type
Purchase Money Mortgage
Estimated Equity
$144,128
Purchase Details
Closed on
Dec 12, 2000
Sold by
Ramirez Michael A and Ramirez Grace
Bought by
Baker Thomas Dwayne and Baker Patricia Ann
Create a Home Valuation Report for This Property
The Home Valuation Report is an in-depth analysis detailing your home's value as well as a comparison with similar homes in the area
Home Values in the Area
Average Home Value in this Area
Purchase History
| Date | Buyer | Sale Price | Title Company |
|---|---|---|---|
| Montelongo Andres | -- | Texas American Title Company | |
| Baker Thomas Dwayne | -- | Texas American Title Company | |
| Baker Thomas Dwayne | -- | -- |
Source: Public Records
Mortgage History
| Date | Status | Borrower | Loan Amount |
|---|---|---|---|
| Open | Montelongo Andres | $56,810 |
Source: Public Records
Tax History Compared to Growth
Tax History
| Year | Tax Paid | Tax Assessment Tax Assessment Total Assessment is a certain percentage of the fair market value that is determined by local assessors to be the total taxable value of land and additions on the property. | Land | Improvement |
|---|---|---|---|---|
| 2025 | $716 | $141,296 | $70,131 | $71,165 |
| 2024 | $716 | $141,296 | $70,131 | $71,165 |
| 2023 | $716 | $134,938 | $56,104 | $78,834 |
| 2022 | $1,582 | $103,331 | $36,467 | $66,864 |
| 2021 | $1,497 | $80,002 | $36,467 | $43,535 |
| 2020 | $1,443 | $70,450 | $30,858 | $39,592 |
| 2019 | $1,342 | $70,450 | $30,858 | $39,592 |
| 2018 | $299 | $46,435 | $10,519 | $35,916 |
| 2017 | $1,221 | $46,435 | $10,519 | $35,916 |
| 2016 | $1,221 | $46,435 | $10,519 | $35,916 |
| 2015 | $628 | $46,435 | $10,519 | $35,916 |
| 2014 | $628 | $0 | $0 | $0 |
Source: Public Records
Map
Nearby Homes
- 16516 Market St
- 16534 Market St
- 108 Cedar Ln
- 812 Coolidge St
- 431 Crockett St
- 908 Lakeside Dr
- 16305 De Zavalla Rd
- 16809 Market St
- 16032 1/2 Ridlon St
- 523 Sheldon Rd
- 16023 Ridlon St
- 16931 Avenue B
- 0 Laurelwood Dr Unit 43034610
- 16134 Palm St
- 16736 Forest Trail Dr
- 16811 Forest Trail Dr
- 822 Woodhue St
- 1109 Becker St
- 00 Laurelwood Dr
- 16600 Laurelwood Dr