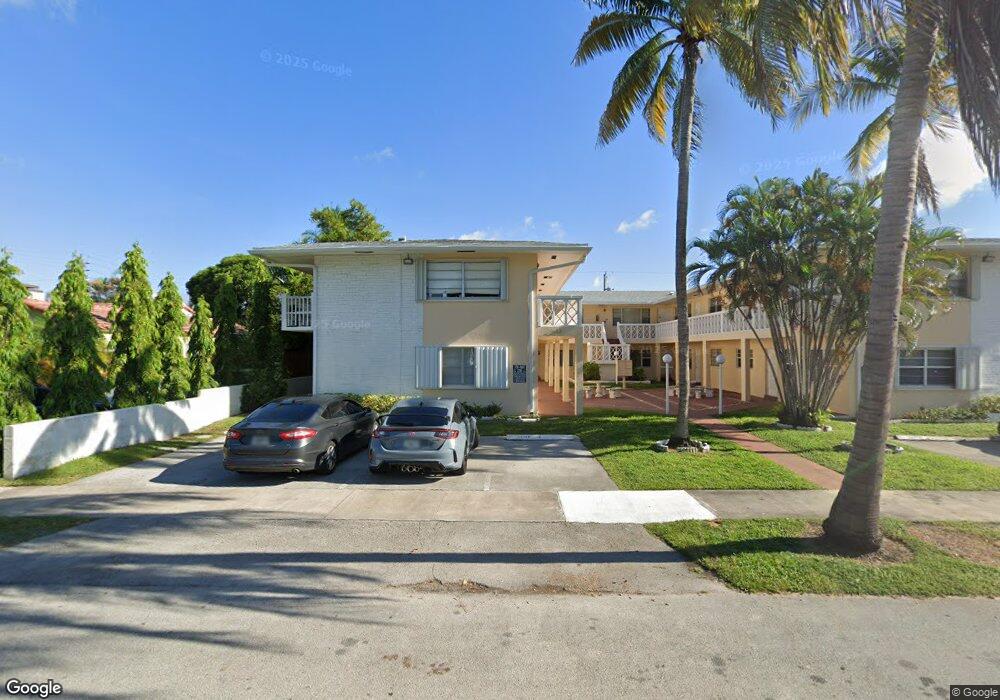
1643 1643 Wiley St # 1 Unit 1 Hollywood, FL 33020
Parkside NeighborhoodEstimated Value: $145,848 - $169,000
2
Beds
2
Baths
738
Sq Ft
$212/Sq Ft
Est. Value
About This Home
This home is located at 1643 1643 Wiley St # 1 Unit 1, Hollywood, FL 33020 and is currently estimated at $156,712, approximately $212 per square foot. 1643 1643 Wiley St # 1 Unit 1 is a home located in Broward County with nearby schools including Hollywood Central Elementary School, Olsen Middle School, and South Broward High School.
Ownership History
Date
Name
Owned For
Owner Type
Purchase Details
Closed on
Jan 31, 2020
Sold by
Da Realtor Llc
Bought by
Erf Inc
Current Estimated Value
Purchase Details
Closed on
Oct 24, 2018
Sold by
Abreu Dayana and Abreu Danay
Bought by
Da Realtor Llc
Purchase Details
Closed on
Oct 19, 2010
Sold by
Deutsche Bank National Trust Company
Bought by
Abreu Dayana and Abreu Danay
Purchase Details
Closed on
May 26, 2005
Sold by
Miller Merrill A
Bought by
Acevedo Pablo and Angrita Carolina
Home Financials for this Owner
Home Financials are based on the most recent Mortgage that was taken out on this home.
Original Mortgage
$85,600
Interest Rate
6.89%
Mortgage Type
Purchase Money Mortgage
Purchase Details
Closed on
Mar 12, 1999
Sold by
Long Clark Lydia M
Bought by
Miller Merrill A
Create a Home Valuation Report for This Property
The Home Valuation Report is an in-depth analysis detailing your home's value as well as a comparison with similar homes in the area
Home Values in the Area
Average Home Value in this Area
Purchase History
| Date | Buyer | Sale Price | Title Company |
|---|---|---|---|
| Erf Inc | $111,500 | Attorney | |
| Da Realtor Llc | -- | None Available | |
| Abreu Dayana | $27,000 | Lancastle Title Llc | |
| Acevedo Pablo | $107,000 | Broward Title Company | |
| Miller Merrill A | -- | Broward Title Company |
Source: Public Records
Mortgage History
| Date | Status | Borrower | Loan Amount |
|---|---|---|---|
| Previous Owner | Acevedo Pablo | $85,600 |
Source: Public Records
Tax History Compared to Growth
Tax History
| Year | Tax Paid | Tax Assessment Tax Assessment Total Assessment is a certain percentage of the fair market value that is determined by local assessors to be the total taxable value of land and additions on the property. | Land | Improvement |
|---|---|---|---|---|
| 2025 | $3,258 | $141,760 | $14,180 | $127,580 |
| 2024 | $3,076 | $141,760 | $14,180 | $127,580 |
| 2023 | $3,076 | $124,280 | $0 | $0 |
| 2022 | $2,766 | $112,990 | $0 | $0 |
| 2021 | $2,467 | $102,720 | $10,270 | $92,450 |
| 2020 | $2,410 | $100,310 | $10,030 | $90,280 |
| 2019 | $2,453 | $100,670 | $10,070 | $90,600 |
| 2018 | $2,314 | $96,530 | $9,650 | $86,880 |
| 2017 | $2,292 | $98,270 | $0 | $0 |
| 2016 | $2,235 | $93,600 | $0 | $0 |
| 2015 | $351 | $29,700 | $0 | $0 |
| 2014 | $308 | $29,470 | $0 | $0 |
| 2013 | -- | $29,040 | $2,900 | $26,140 |
Source: Public Records
Map
Nearby Homes
- 1623 Wiley St
- 1629 Mayo St
- 1321 S 16th Ave
- 1615 Mayo St
- 1611 Mayo St
- 1623 Mayo St
- 1600 Mayo St
- 1704 Rodman St
- 1623 Fletcher St
- 1700 Mayo St
- 1625 Fletcher St
- 1516 Wiley St
- 1733 Mayo St Unit 6
- 1116 S 17th Ave
- 1612 Funston St
- 1640 Funston St
- 1717 Rodman St Unit 15
- 1717 Rodman St Unit 18
- 1619 Moffett St
- 1607 Moffett St
- 1647 Wiley St
- 1635 Wiley St
- 1642 Plunkett St
- 1644 Plunkett St
- 1644 Plunkett St Unit EAST
- 1644 Plunkett St Unit 1-2
- 1638 Plunkett St Unit 10
- 1638 Plunkett St Unit 4
- 1638 Plunkett St Unit 3
- 1638 Plunkett St Unit 7
- 1638 Plunkett St
- 1627 Wiley St
- 1401 S 17th Ave
- 1314 S 17th Ave Unit 1
- 1314 S 17th Ave Unit 1316
- 1314 S 17th Ave Unit 1314
- 1314 S 17th Ave Unit 2
- 1314 S 17th Ave Unit North
- 1314 S 17th Ave Unit 1-2
- 1316 S 17th Ave Unit 1