1643 Briarcliff Rd NE Unit IT Atlanta, GA 30306
Woodland Hills NeighborhoodEstimated Value: $211,000 - $235,000
2
Beds
1
Bath
884
Sq Ft
$251/Sq Ft
Est. Value
About This Home
This home is located at 1643 Briarcliff Rd NE Unit IT, Atlanta, GA 30306 and is currently estimated at $221,530, approximately $250 per square foot. 1643 Briarcliff Rd NE Unit IT is a home located in DeKalb County with nearby schools including Fernbank Elementary School, Druid Hills Middle School, and Druid Hills High School.
Ownership History
Date
Name
Owned For
Owner Type
Purchase Details
Closed on
Feb 25, 2022
Sold by
Oneill Janice
Bought by
Briles Mason Weston
Current Estimated Value
Home Financials for this Owner
Home Financials are based on the most recent Mortgage that was taken out on this home.
Original Mortgage
$164,900
Outstanding Balance
$153,793
Interest Rate
3.92%
Mortgage Type
Cash
Estimated Equity
$67,737
Purchase Details
Closed on
Jun 22, 2016
Sold by
Mark Peter
Bought by
Birnbaum Peter Mark and Oneill Janice
Purchase Details
Closed on
Mar 30, 2015
Sold by
Davis Erin L
Bought by
Birnbaum Peter Mark
Purchase Details
Closed on
Dec 10, 2001
Sold by
1639 1643 & 1647 Briarcliff Llc
Bought by
Davis Erin L
Home Financials for this Owner
Home Financials are based on the most recent Mortgage that was taken out on this home.
Original Mortgage
$113,000
Interest Rate
6.42%
Mortgage Type
New Conventional
Create a Home Valuation Report for This Property
The Home Valuation Report is an in-depth analysis detailing your home's value as well as a comparison with similar homes in the area
Home Values in the Area
Average Home Value in this Area
Purchase History
| Date | Buyer | Sale Price | Title Company |
|---|---|---|---|
| Briles Mason Weston | $170,000 | -- | |
| Birnbaum Peter Mark | -- | -- | |
| Birnbaum Peter Mark | $107,000 | -- | |
| Davis Erin L | $119,000 | -- |
Source: Public Records
Mortgage History
| Date | Status | Borrower | Loan Amount |
|---|---|---|---|
| Open | Briles Mason Weston | $164,900 | |
| Previous Owner | Davis Erin L | $113,000 |
Source: Public Records
Tax History Compared to Growth
Tax History
| Year | Tax Paid | Tax Assessment Tax Assessment Total Assessment is a certain percentage of the fair market value that is determined by local assessors to be the total taxable value of land and additions on the property. | Land | Improvement |
|---|---|---|---|---|
| 2025 | $2,320 | $85,280 | $14,000 | $71,280 |
| 2024 | $2,327 | $80,800 | $14,000 | $66,800 |
| 2023 | $2,327 | $68,000 | $13,800 | $54,200 |
| 2022 | $3,330 | $75,320 | $14,000 | $61,320 |
| 2021 | $2,952 | $66,720 | $14,000 | $52,720 |
| 2020 | $2,952 | $66,720 | $14,000 | $52,720 |
| 2019 | $2,952 | $66,720 | $14,000 | $52,720 |
| 2018 | $1,827 | $51,840 | $10,400 | $41,440 |
| 2017 | $2,234 | $50,120 | $10,400 | $39,720 |
| 2016 | $1,825 | $40,760 | $28,080 | $12,680 |
| 2014 | -- | $35,840 | $28,080 | $7,760 |
Source: Public Records
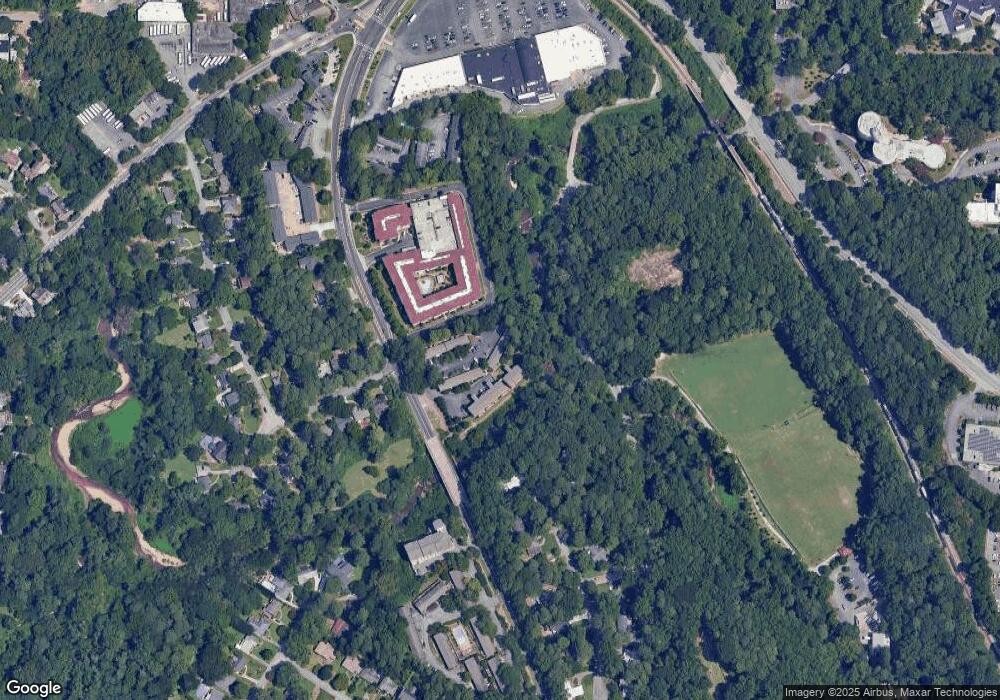
Map
Nearby Homes
- 1647 Briarcliff Rd NE Unit 9
- 1647 Briarcliff Rd NE Unit 8
- 1635 Briarcliff Road #8 Rd NE
- 1635 Briarcliff Rd NE Unit 8
- 1683 Briarcliff Rd NE Unit 2
- 1879 Johnson Rd NE Unit 3
- 1742 Helen Dr NE
- 5431 Biltmore Dr
- 5435 Biltmore Dr
- 0 Webb #0 Ave NW Unit 7467605
- 00 Webb Lot #00 Ave
- 1494 Red Fox Dr NE Unit D
- 1045 Shepherds Ln NE
- 1785 Meadowdale Ave NE
- 1274 Edmund Park Dr NE
- 1370 Edmund Ct NE
- 1404 Briarcliff Rd NE
- 1054 Vista Trail NE
- 1099 Vista Trail NE
- 1476 E Rock Springs Rd NE
- 1643 Briarcliff Rd NE Unit 2
- 1643 Briarcliff Rd NE Unit 9
- 1643 Briarcliff Rd NE Unit 5
- 1643 Briarcliff Rd NE Unit 6
- 1643 Briarcliff Rd NE Unit 3
- 1643 Briarcliff Rd NE Unit 7
- 1643 Briarcliff Rd NE Unit 8
- 1643 Briarcliff Rd NE Unit 10
- 1643 Briarcliff Rd NE Unit IT
- 1643 Briarcliff Rd NE Unit IT
- 1643 Briarcliff Rd NE Unit IT
- 1643 Briarcliff Rd NE Unit IT
- 1643 Briarcliff Rd NE Unit IT
- 1643 Briarcliff Rd NE Unit IT
- 1643 Briarcliff Rd NE Unit IT
- 1643 Briarcliff Rd NE Unit IT
- 1643 Briarcliff Rd NE Unit 1643
- 1643 Briarcliff Rd NE
- 1643 Briarcliff Rd NE Unit 1
- 1639 Briarcliff Rd NE Unit 9