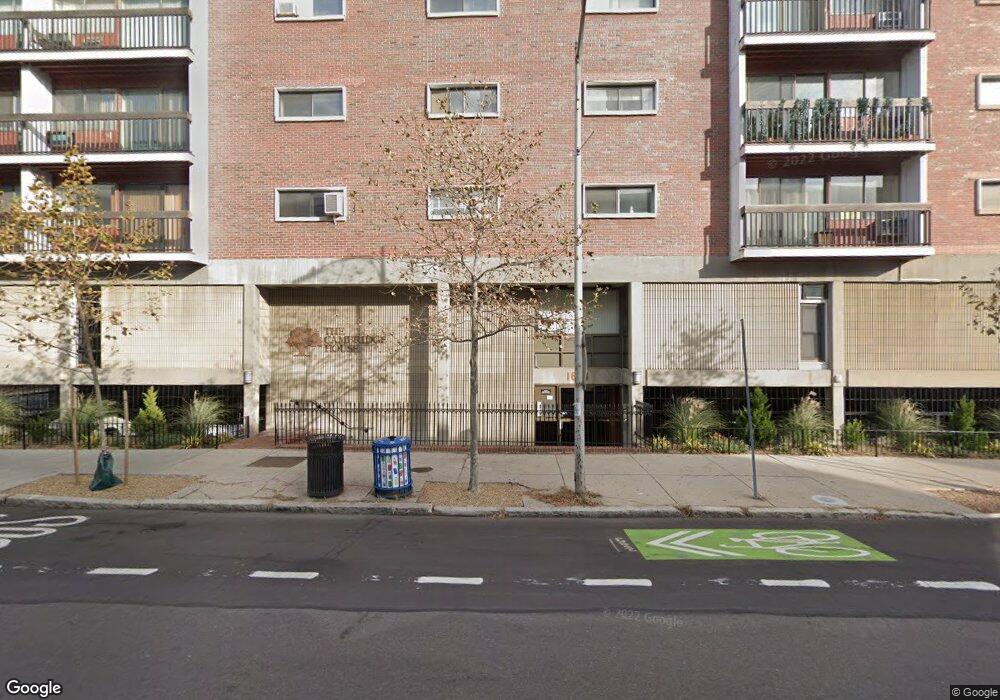
1643 Cambridge St Unit 66 Cambridge, MA 02138
Mid-Cambridge NeighborhoodEstimated Value: $687,000 - $795,000
2
Beds
1
Bath
750
Sq Ft
$990/Sq Ft
Est. Value
About This Home
This home is located at 1643 Cambridge St Unit 66, Cambridge, MA 02138 and is currently estimated at $742,466, approximately $989 per square foot. 1643 Cambridge St Unit 66 is a home located in Middlesex County with nearby schools including Saint Paul's Choir School.
Ownership History
Date
Name
Owned For
Owner Type
Purchase Details
Closed on
May 10, 2017
Sold by
Li Jingying and Li Wayne
Bought by
Jingying Li Ret
Current Estimated Value
Purchase Details
Closed on
Jul 31, 2007
Sold by
Lu Ching-Hao
Bought by
Li Jingying and Li Wayne
Home Financials for this Owner
Home Financials are based on the most recent Mortgage that was taken out on this home.
Original Mortgage
$271,200
Interest Rate
6.78%
Mortgage Type
Purchase Money Mortgage
Purchase Details
Closed on
Nov 27, 2000
Sold by
Est Bloomfield Arthur and Bloomfield Micah W
Bought by
Lu Ching-Hao
Home Financials for this Owner
Home Financials are based on the most recent Mortgage that was taken out on this home.
Original Mortgage
$160,000
Interest Rate
7.78%
Mortgage Type
Purchase Money Mortgage
Create a Home Valuation Report for This Property
The Home Valuation Report is an in-depth analysis detailing your home's value as well as a comparison with similar homes in the area
Home Values in the Area
Average Home Value in this Area
Purchase History
| Date | Buyer | Sale Price | Title Company |
|---|---|---|---|
| Jingying Li Ret | -- | -- | |
| Li Jingying | $339,000 | -- | |
| Lu Ching-Hao | $260,000 | -- |
Source: Public Records
Mortgage History
| Date | Status | Borrower | Loan Amount |
|---|---|---|---|
| Previous Owner | Lu Ching-Hao | $251,000 | |
| Previous Owner | Li Jingying | $271,200 | |
| Previous Owner | Lu Ching-Hao | $160,000 |
Source: Public Records
Tax History Compared to Growth
Tax History
| Year | Tax Paid | Tax Assessment Tax Assessment Total Assessment is a certain percentage of the fair market value that is determined by local assessors to be the total taxable value of land and additions on the property. | Land | Improvement |
|---|---|---|---|---|
| 2025 | $3,723 | $586,300 | $0 | $586,300 |
| 2024 | $3,387 | $572,100 | $0 | $572,100 |
| 2023 | $3,662 | $624,900 | $0 | $624,900 |
| 2022 | $3,651 | $616,700 | $0 | $616,700 |
| 2021 | $3,500 | $598,300 | $0 | $598,300 |
| 2020 | $3,403 | $591,800 | $0 | $591,800 |
| 2019 | $3,271 | $550,700 | $0 | $550,700 |
| 2018 | $1,072 | $507,400 | $0 | $507,400 |
| 2017 | $3,004 | $462,900 | $0 | $462,900 |
| 2016 | $2,878 | $411,800 | $0 | $411,800 |
| 2015 | $2,855 | $365,100 | $0 | $365,100 |
| 2014 | $2,714 | $323,900 | $0 | $323,900 |
Source: Public Records
Map
Nearby Homes
- 1657 Cambridge St
- 13 Roberts Rd
- 106 Ellery St
- 114 Trowbridge St Unit 2
- 60 Ellery St
- 2 Ellery Square
- 55 Ellery St Unit 3
- 33 Line St Unit 1
- 39 Ellery St Unit 6
- 89 Kirkland St Unit 89
- 97 Beacon St
- 329 Harvard St Unit 1
- 11 Dana St Unit D
- 8 Chatham St Unit 4
- 15 Trowbridge St Unit 12A
- 5 Waldo Ave Unit 2A
- 75 Fayette St Unit 3
- 5 Centre St Unit 32
- 73 Marion St Unit 2
- 950 Massachusetts Ave Unit 418
- 1643 Cambridge St Unit 77
- 1643 Cambridge St Unit 76
- 1643 Cambridge St Unit 75
- 1643 Cambridge St Unit 74
- 1643 Cambridge St Unit 73
- 1643 Cambridge St Unit 72
- 1643 Cambridge St Unit 71
- 1643 Cambridge St Unit 67
- 1643 Cambridge St Unit 64
- 1643 Cambridge St Unit 63
- 1643 Cambridge St Unit 62
- 1643 Cambridge St Unit 61
- 1643 Cambridge St Unit 57
- 1643 Cambridge St Unit 56
- 1643 Cambridge St Unit 55
- 1643 Cambridge St Unit 54
- 1643 Cambridge St Unit 53
- 1643 Cambridge St Unit 52
- 1643 Cambridge St Unit 51
- 1643 Cambridge St Unit 47