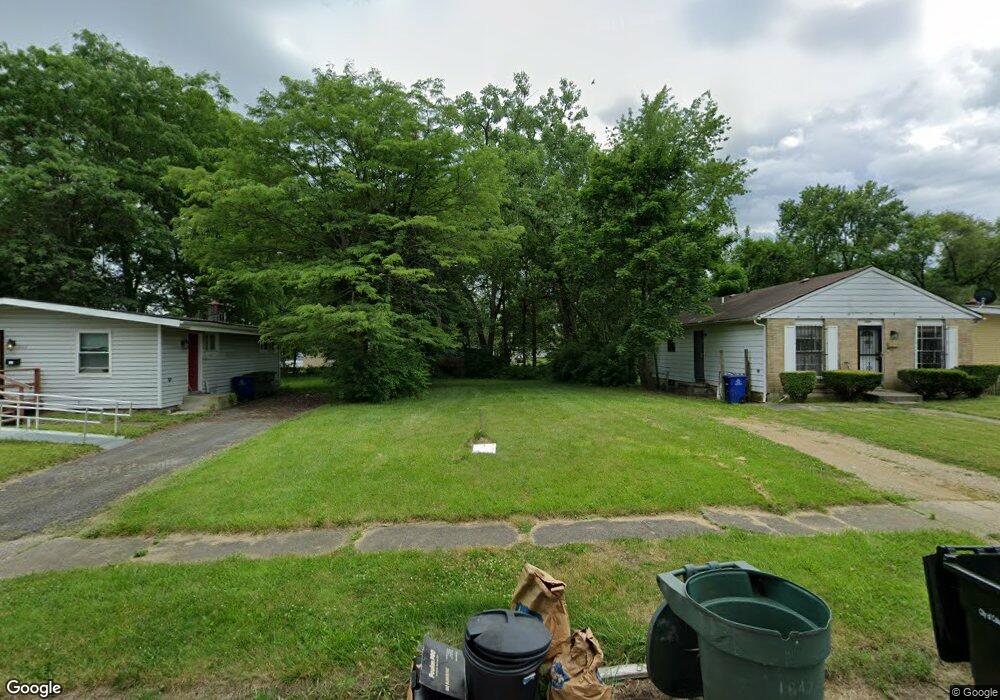
1643 E Maynard Ave Columbus, OH 43219
Argyle Park NeighborhoodEstimated Value: $100,692
3
Beds
1
Bath
858
Sq Ft
$117/Sq Ft
Est. Value
About This Home
This home is located at 1643 E Maynard Ave, Columbus, OH 43219 and is currently estimated at $100,692, approximately $117 per square foot. 1643 E Maynard Ave is a home located in Franklin County with nearby schools including Windsor Stem Acadmey, Linden-Mckinley Stem School On Arcadia, and Graham Elementary and Middle School.
Ownership History
Date
Name
Owned For
Owner Type
Purchase Details
Closed on
Jun 26, 2019
Sold by
Cental Ohio Community Improvement Corp
Bought by
City Of Columbus
Current Estimated Value
Purchase Details
Closed on
Mar 20, 2019
Sold by
Municipal Tax Property Llc
Bought by
Central Ohio Community Improvement Corp
Purchase Details
Closed on
Mar 28, 2013
Sold by
Crofco Enterprises Llc
Bought by
Municipal Tax Property Llc
Purchase Details
Closed on
Jan 3, 2006
Sold by
Equity Trust Co
Bought by
Crofco Enterprises Llc
Purchase Details
Closed on
Sep 9, 2004
Sold by
Gregg Fitzpatrick Inc
Bought by
Equity Trust
Purchase Details
Closed on
Aug 1, 1986
Create a Home Valuation Report for This Property
The Home Valuation Report is an in-depth analysis detailing your home's value as well as a comparison with similar homes in the area
Home Values in the Area
Average Home Value in this Area
Purchase History
| Date | Buyer | Sale Price | Title Company |
|---|---|---|---|
| City Of Columbus | -- | None Available | |
| Central Ohio Community Improvement Corp | -- | None Available | |
| Municipal Tax Property Llc | -- | None Available | |
| Crofco Enterprises Llc | $46,000 | Contract Pr | |
| Equity Trust | -- | -- | |
| -- | -- | -- |
Source: Public Records
Tax History
| Year | Tax Paid | Tax Assessment Tax Assessment Total Assessment is a certain percentage of the fair market value that is determined by local assessors to be the total taxable value of land and additions on the property. | Land | Improvement |
|---|---|---|---|---|
| 2025 | -- | $4,410 | $4,410 | -- |
| 2024 | -- | $4,410 | $4,410 | -- |
| 2023 | -- | $4,410 | $4,410 | $0 |
| 2022 | $0 | $2,660 | $2,660 | $0 |
| 2021 | $0 | $2,660 | $2,660 | $0 |
Source: Public Records
Map
Nearby Homes
- 1684 E Blake Ave
- 1554 E Maynard Ave
- 1564-1566 E Blake Ave
- 1810 E 26th Ave
- 1625 Kenmore Rd
- 1608 Kenmore Rd
- 2126 Cleveland Ave
- 2163 Cleveland Ave Unit 2161
- 1805 E 26th Ave
- 0 E Maynard Ave
- 1457 Cordell Ave
- 1481 Kohr Place
- 2305 Cleveland Ave
- 1430 Kenmore Rd
- 1864 E Hudson St
- 1435 Kohr Place
- 2195 Dresden St
- 1509 Loretta Ave
- 1386 E 22nd Ave
- 1335 E 25th Ave Unit 337
- 1639 E Maynard Ave
- 1649 E Maynard Ave
- 0 E Maynard Ave
- 1655 E Maynard Ave
- 1631 E Maynard Ave
- 1640 Duxberry Ave
- 1634 Duxberry Ave
- 1663 E Maynard Ave
- 1646 Duxberry Ave
- 1628 Duxberry Ave
- 1644 E Maynard Ave
- 1652 Duxberry Ave
- 2080 Bancroft St
- 1656 E Maynard Ave
- 1620 Duxberry Ave
- 1669 E Maynard Ave
- 1660 Duxberry Ave
- 1675 E Maynard Ave
- 1668 E Maynard Ave
- 2065 Bancroft St
Your Personal Tour Guide
Ask me questions while you tour the home.